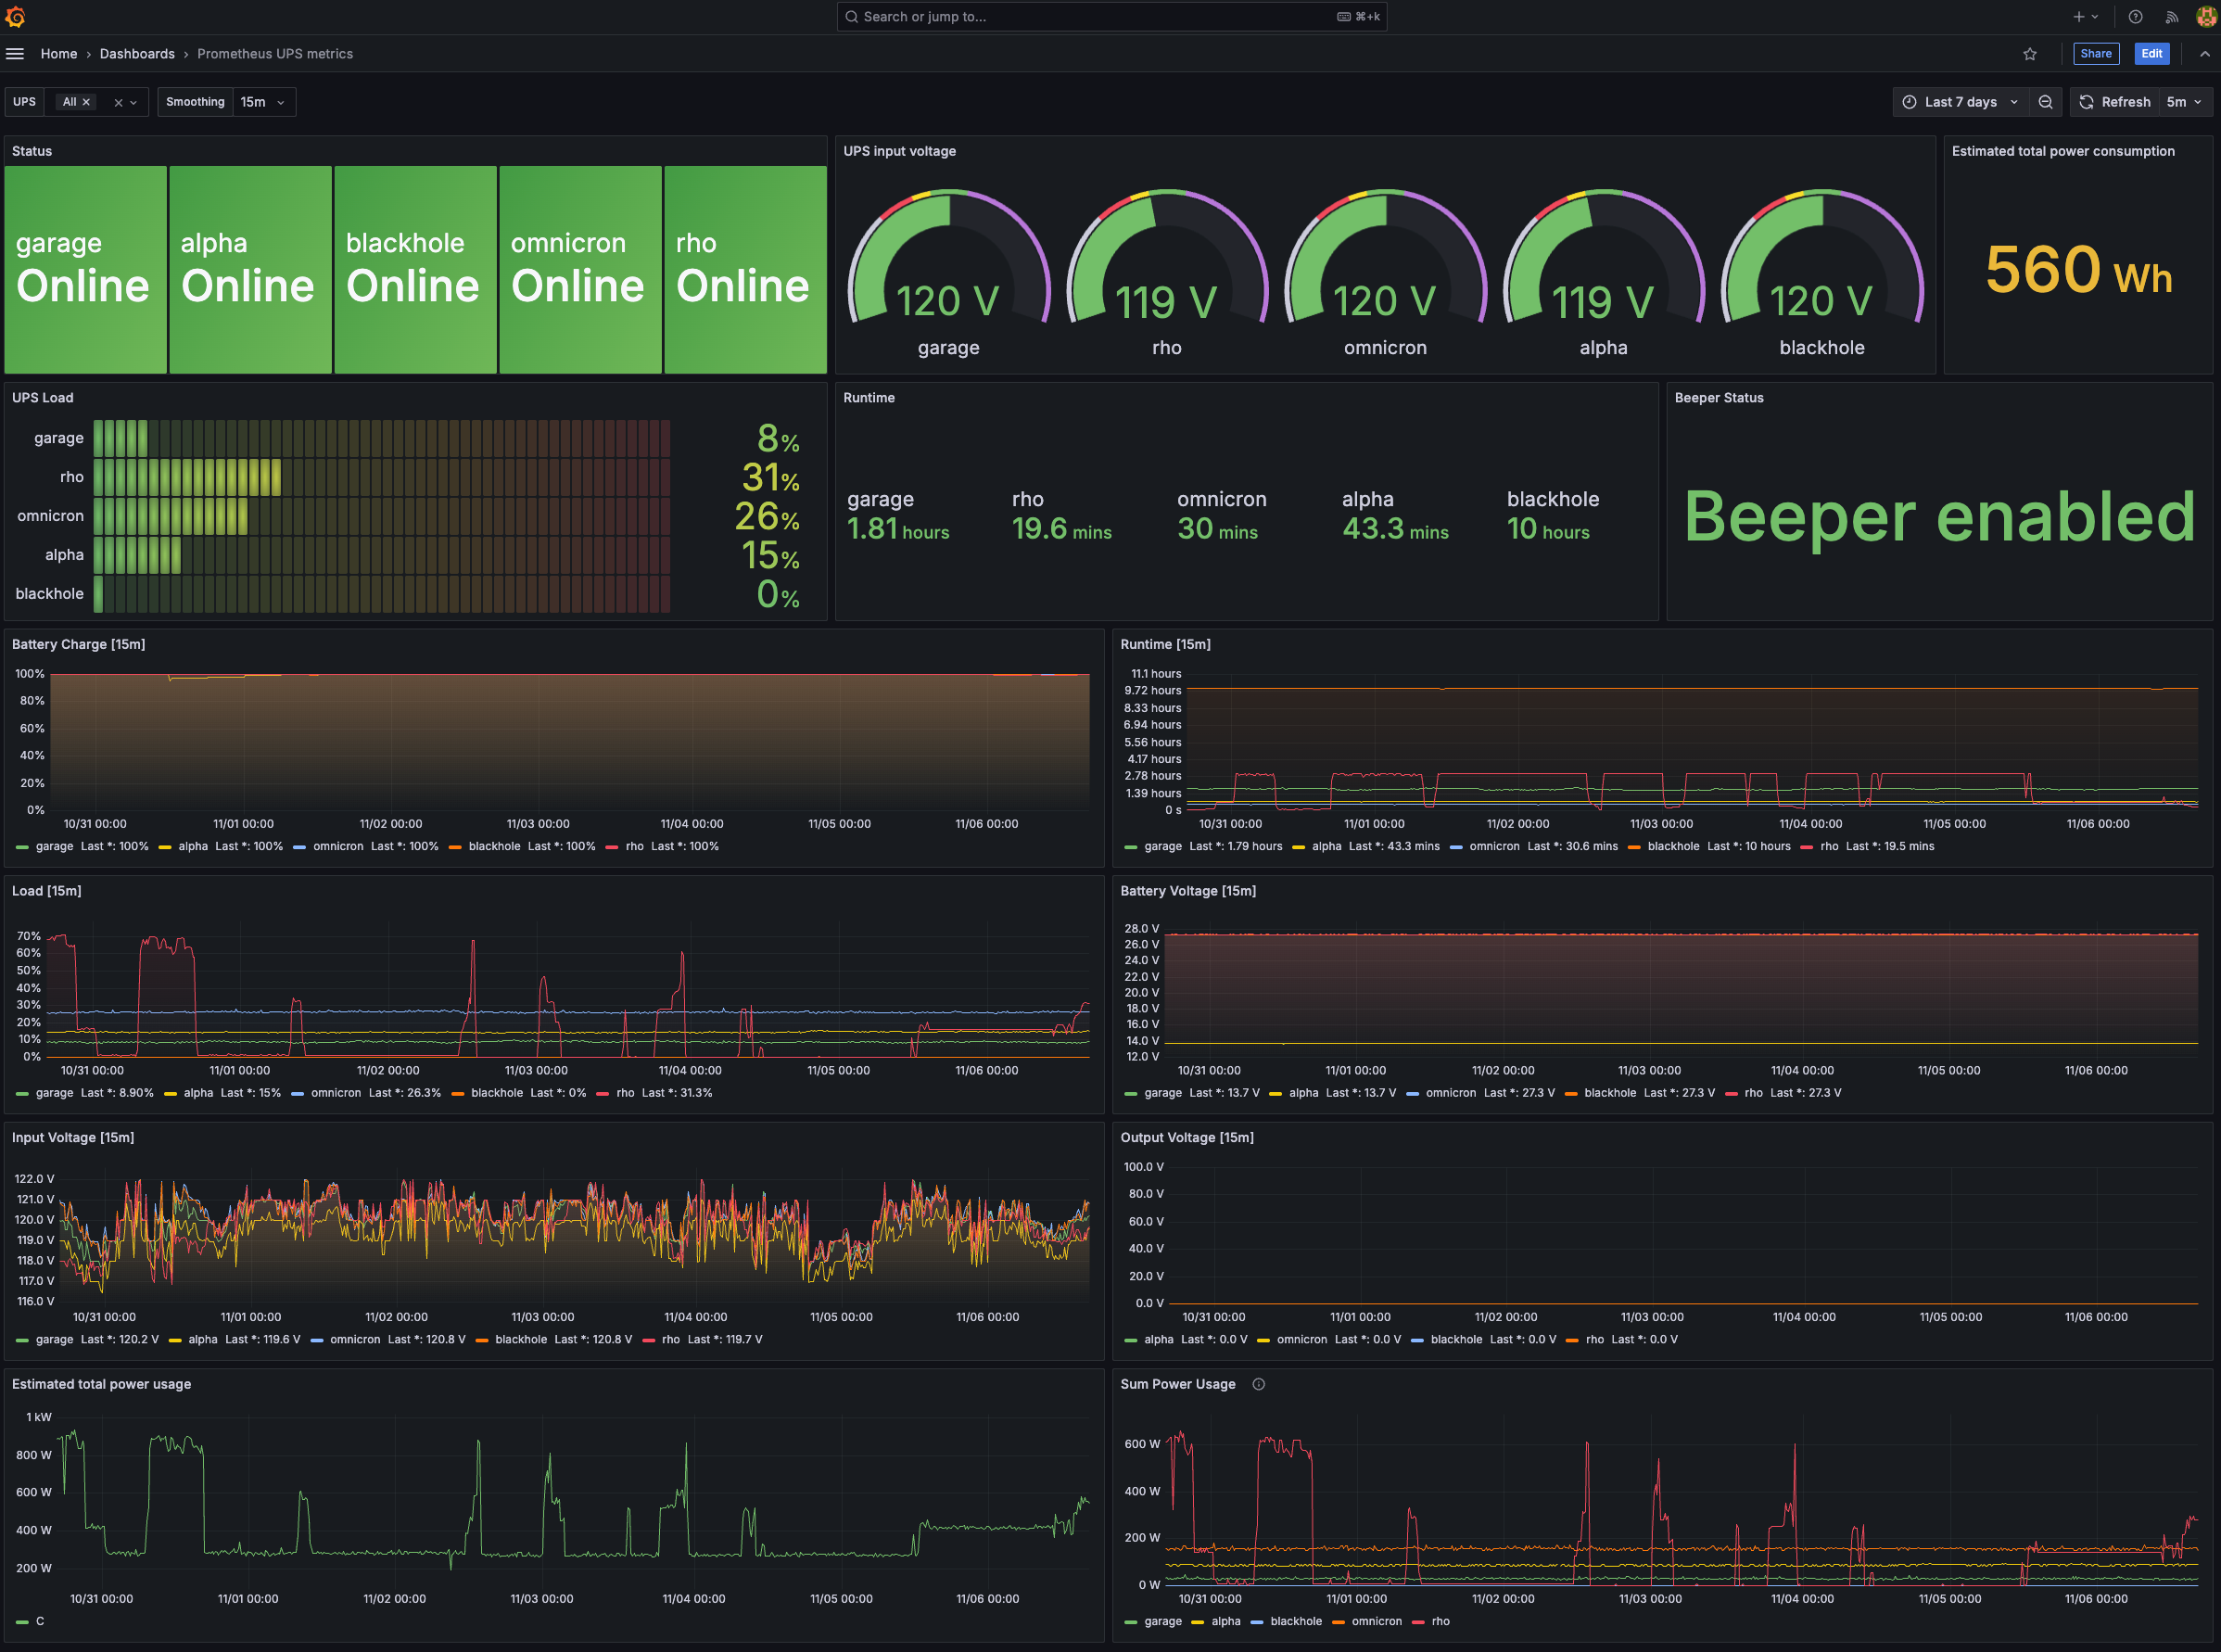
apcupsd Grafana Dashboard
Now that I have started to collect metrics for my APC UPS systems, I built a Grafana dashboard similar to the dashboard I used for Network UPS Tools. Check out a previous post where I got these metrics set up and into Prometheus.

This dashboard is based on a public Grafana dashboard for the NUT exporter that I used previously. Fortunately most metrics from Network UPS Tools are also available here in the apcupsd exporter.
I made some additions at the bottom to estimate total power usage for all UPS systems as well as the estimated power usage of each UPS.
This dashboard along with others I maintain are available on GitHub.
Link updated: 2025-10-12