Diagrams as code
Creating Diagrams with Mermaid.js
Mermaid is a JavaScript library for creating diagrams and flowcharts using a simple and intuitive markdown-like syntax. Mermaid.js allows developers and users to generate various types of diagrams, including flowcharts, sequence diagrams, Gantt charts, class diagrams, and more, directly in the browser or as part of web applications. It is already integrated in:
- vscode
- obsidian
- github
Setup
First, you need to include the Mermaid.js library in your project. You can do this by adding the following script tag to your HTML file:
<script src="https://unpkg.com/mermaid/dist/mermaid.min.js"></script>Alternatively if you are using a markdown file, add a code block and tag it as mermaid
```mermaid
Alternatively, if using in a Javascript project, you need to configure Mermaid. This can be done using the mermaid.initialize() function. Here’s an example:
mermaid.initialize({
  startOnLoad: true,
  theme: 'forest',
});
Creating Diagrams
HTML diagrams
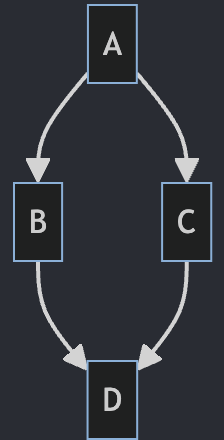
Now, you’re ready to create diagrams! Mermaid.js supports various types of diagrams such as flowcharts, sequence diagrams, class diagrams, state diagrams, etc. Here’s how you can create a simple flowchart:
<div class="mermaid">graph TD; A-->B; A-->C; B-->D; C-->D;</div>In the above code, graph TD; specifies that we’re creating a flowchart with top-down (TD) direction. A-->B; creates an arrow from A to B.
Markdown diagrams
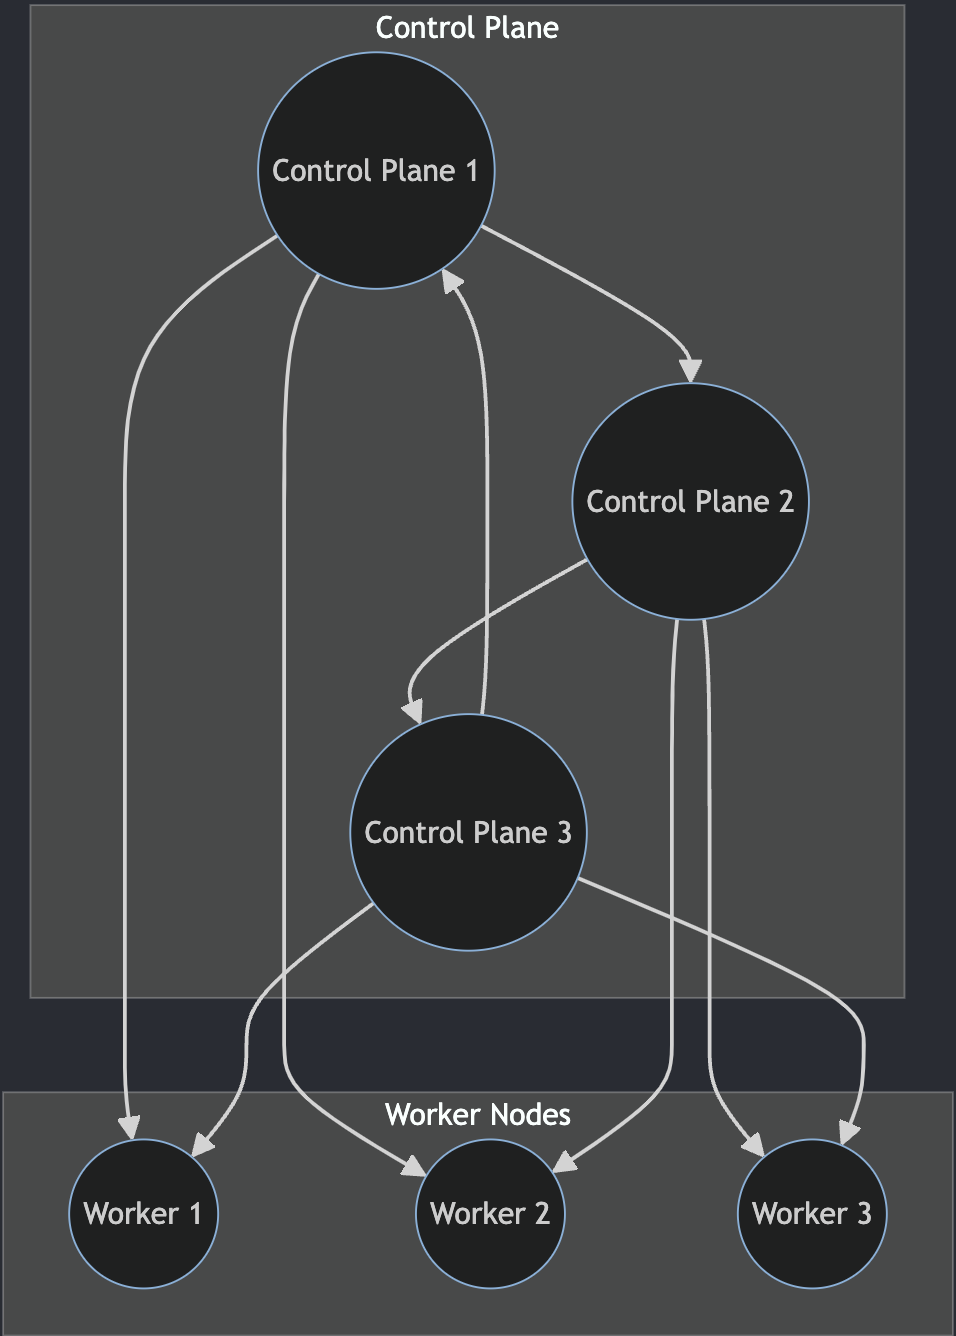
In this example we create subgraphs to illustrate a cluster of Kubernetes nodes.
graph TD;

  subgraph Control Plane
    CP1((Control Plane 1))
    CP2((Control Plane 2))
    CP3((Control Plane 3))
  end

  subgraph Worker Nodes
    W1((Worker 1))
    W2((Worker 2))
    W3((Worker 3))
  end

  CP1 --> CP2
  CP2 --> CP3
  CP3 --> CP1

  CP1 --> W1
  CP1 --> W2
  CP2 --> W2
  CP2 --> W3
  CP3 --> W3
  CP3 --> W1
Rendering Diagrams
Mermaid will automatically render the diagrams when the page loads.
If you want to manually render diagrams, you can use the mermaid.render() function in a Javascript block.
If you are use vscode, the markdown preview feature will display mermaid diagrams in the preview window.
If you are using Obsidian, a markdown editor (not open-source), it will also render valid mermaid diagram code blocks in the editor.
Creating Diagrams with python
python diagrams package
The PyPi package diagrams allows you to create diagrams with python code.
Requirements
To set this up, python is required and if on macOS, you need to install Graphviz binary onto your $PATH
- Install
Graphviz
- If on macOS,
brew install graphviz
- Install pip package
diagrams
pip install diagramsExample python diagram
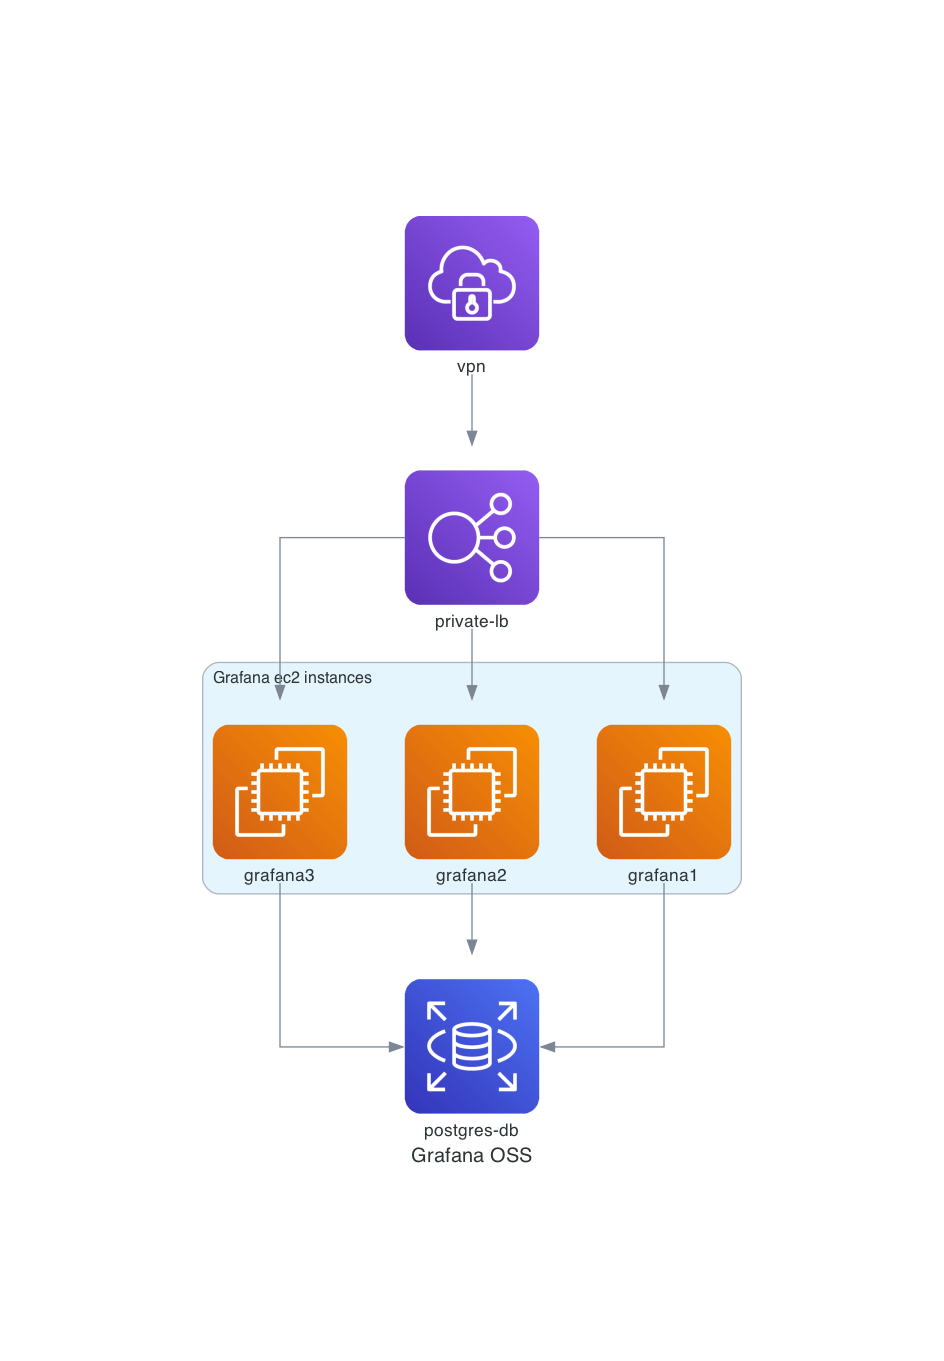
Here is an example diagram that shows a Highly-Available Grafana application running on Amazon Web Services:
Create a file diagram.py
from diagrams import Cluster,Diagram
from diagrams.aws.compute import EC2
from diagrams.aws.database import RDS
from diagrams.aws.network import ELB
from diagrams.aws.network import ClientVpn

with Diagram("Grafana OSS", show=False, direction="TB"):
    lb = ELB("private-lb")
    db = RDS("postgres-db")
    vpn = ClientVpn("vpn")

    with Cluster("Grafana ec2 instances"):
        svc_group = [EC2("grafana1"),
                     EC2("grafana2"),
                     EC2("grafana3")]

    vpn >> lb >> svc_group
    svc_group >> db
This architecture is a private VPC network that requires a VPN client to connect to the load balancer. There are three ec2 instances that run the Grafana application and they connect to a PostgreSQL RDS instance managed by AWS.
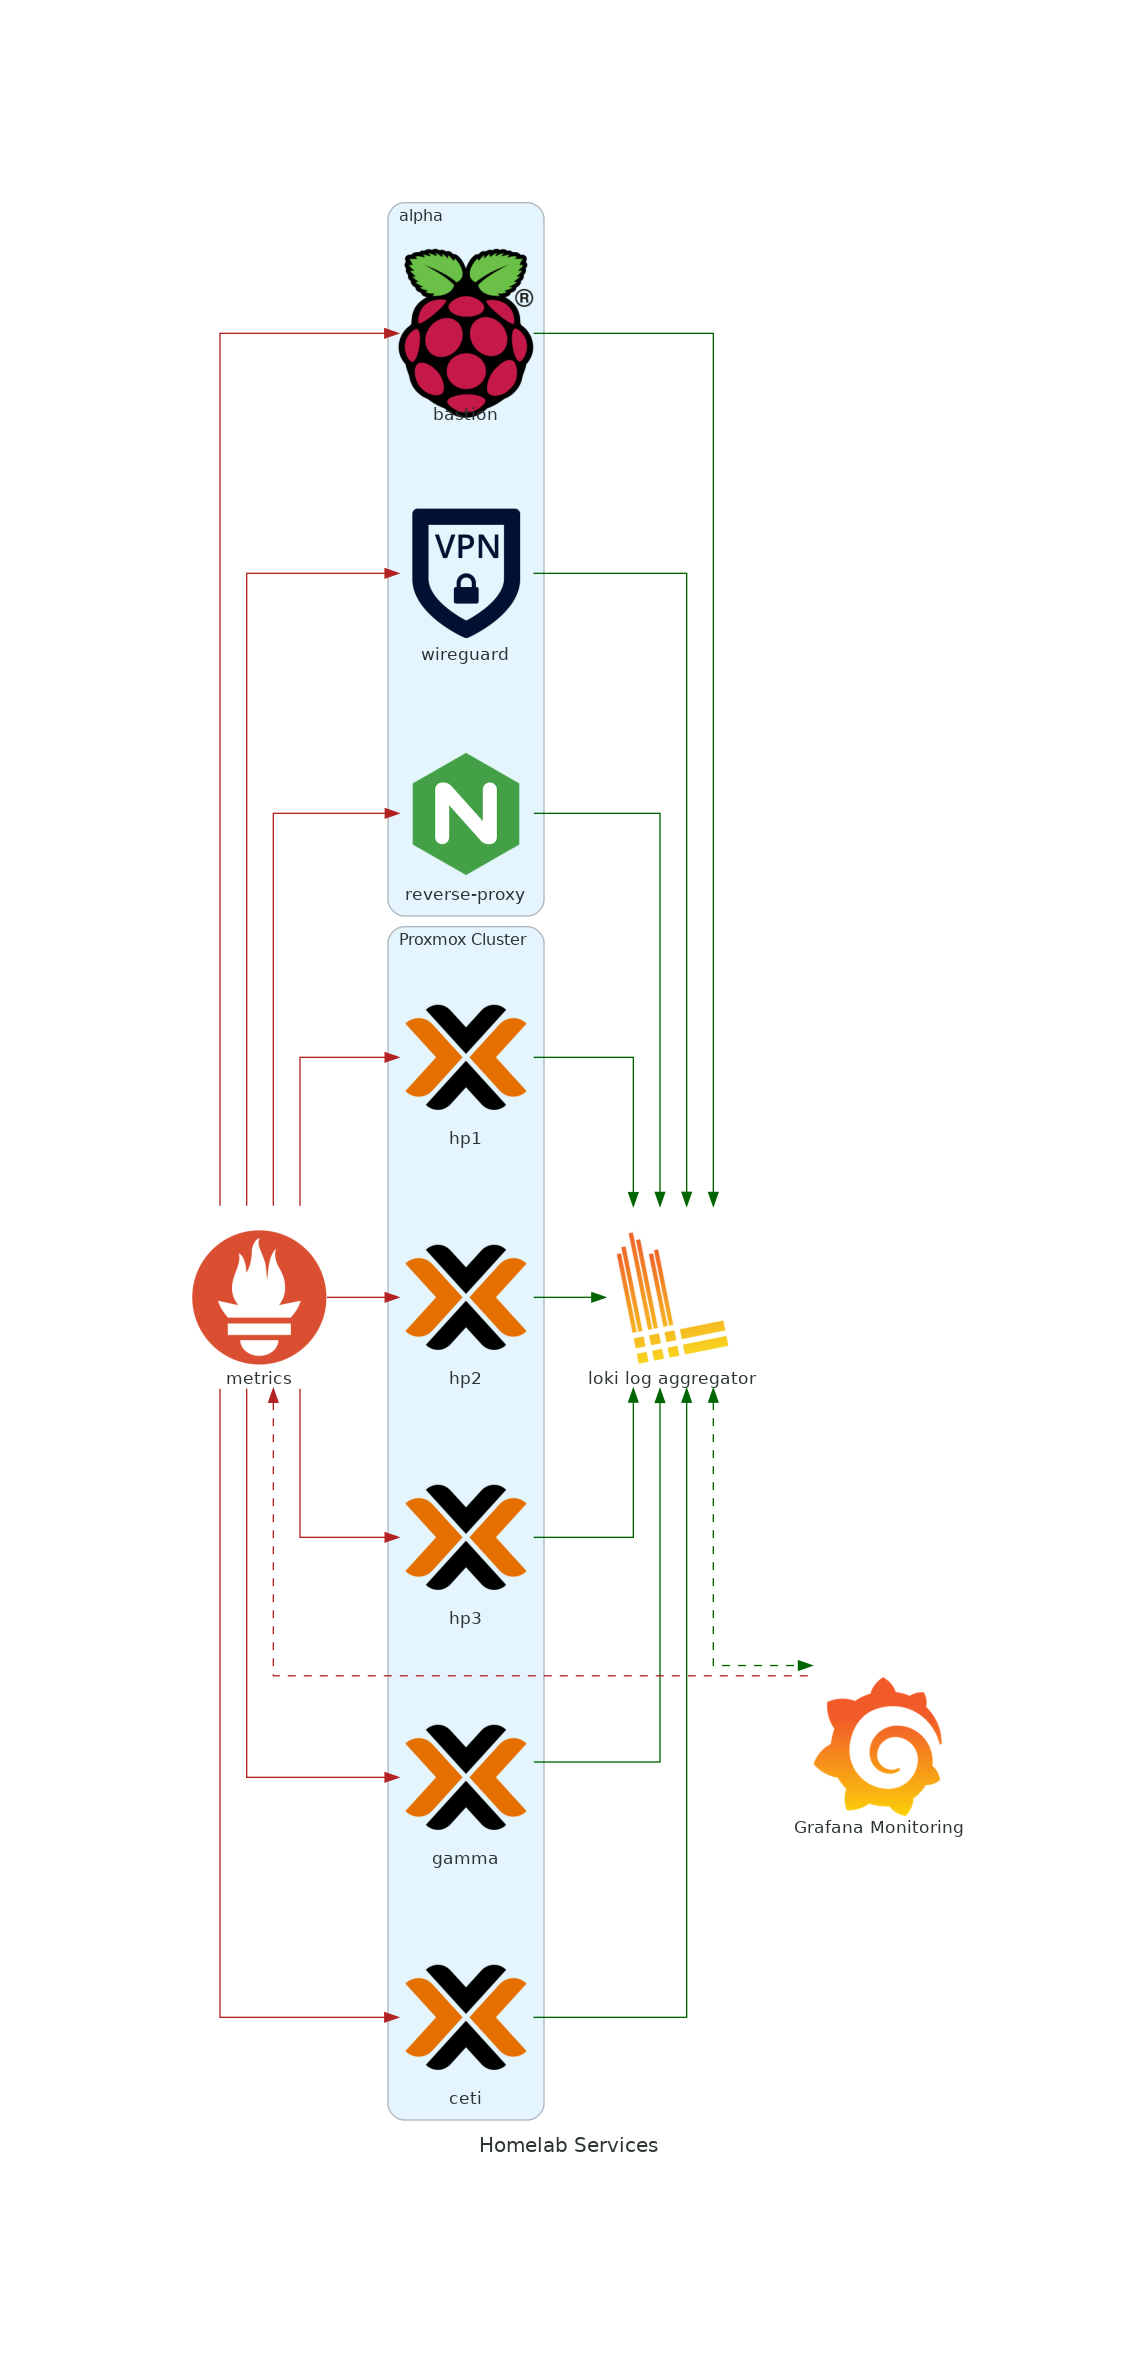
Here is an example of my homelab which uses Proxmox Servers and Raspberry Pi.
homelab.py file
from diagrams import Cluster, Diagram, Edge
from diagrams.onprem.proxmox import Pve
from diagrams.onprem.compute import Server
# from diagrams.onprem.database import PostgreSQL
from diagrams.onprem.logging import Loki
from diagrams.onprem.monitoring import Grafana, Prometheus
from diagrams.generic.os import Raspbian
from diagrams.generic.network import VPN
from diagrams.onprem.network import Nginx


with Diagram(name="Homelab Services", show=False):
    # raspberry pi 4 bastion host
    with Cluster("alpha"):
        alpha = [
            Raspbian("bastion"),
            VPN("wireguard"),
            Nginx("reverse-proxy")]
    # Proxmox compute cluster
    with Cluster("Proxmox Cluster"):
        proxmox = [
            Pve("hp1"),
            Pve("hp2"),
            Pve("hp3"),
            Pve("gamma"),
            Pve("ceti")]
    # observability systems
    grafana = Grafana("Grafana Monitoring")
    metrics = Prometheus("metrics")

    metrics << Edge(color="firebrick", style="dashed") << grafana
    metrics >> Edge(color="firebrick") >> proxmox
    metrics >> Edge(color="firebrick") >> alpha

    # Log aggregation with Grafana Loki
    aggregator = Loki("loki log aggregator")
    proxmox >> Edge(color="darkgreen") >> aggregator << Edge(color="darkgreen", style="dashed") >> grafana
    alpha >> Edge(color="darkgreen") >> aggregator
create a diagram image file
You can create a .png file based on the python file by executing the file.
python diagram.pyThat produces this diagram:
My homelab rendered image:
Conclusion
Mermaid.js and python diagrams are versatile tools for creating diagrams in your web projects. With simple syntax and wide range of supported diagram types, you can greatly enhance the visual appeal and clarity of your documentation or presentations.
Remember, the best way to learn is by doing. So, give it a try and start creating your own diagrams.
Happy diagramming!