Monitor Your Linux System with the Elastic Stack
With the Elastic Stack (formerly known as ELK Stack) and Docker Compose, you can set up a powerful monitoring solution that is also equipped to scale as a backend document database for modern software applications. I am giving it another go in 2025 since I use Elastic in my current job. If you have never heard of Elasticsearch (which is fair if you do not work in software development), check out a previous post for a brief overview of how to get started.
In this guide, we’ll build a complete monitoring platform that tracks everything from CPU usage and memory consumption to disk I/O and network traffic, all visualized in beautiful, interactive dashboards. Best of all? Everything runs in Docker containers, making it portable, repeatable, and easy to tear down when you’re done experimenting. If you are not familiar with Docker and containers, check out a previous post for a basic introduction to containers.
What You’re Building
By the end of this tutorial, you’ll have a fully functional monitoring stack consisting of:
- Elasticsearch - The backend that stores and indexes all your metrics (or other data)
- Kibana - Your visual web UI for exploring data and building dashboards
- Metricbeat - The agent that collects system and other metrics like Docker metrics
- Filebeat (optional) - For shipping system logs alongside metrics
This will result in an architecture where the agents on your system send data to the Elasticsearch container via API (push architecture vs pull architecture found on metric systems such as Prometheus)
Prerequisites: What You’ll Need
Before diving in, make sure you have:
- Docker Engine and Docker Compose installed on your Linux system
- At least 4GB of RAM available (8GB recommended for production-like environments)
- Basic command-line familiarity - you should be comfortable with terminal commands
- A text editor of your choice (vim, nano, VS Code, whatever makes you happy)
Important Linux Configuration
Elasticsearch requires adjusting your system’s virtual memory settings. Run this command as root (via sudo):
sudo sysctl -w vm.max_map_count=262144To make this permanent, add it to /etc/sysctl.conf:
echo "vm.max_map_count=262144" | sudo tee -a /etc/sysctl.confStep 1: Setting Up Your Project Structure
Create a workspace:
mkdir elastic-monitoring
cd elastic-monitoring
mkdir -p config/{elasticsearch,kibana,metricbeat}
Your directory structure should look like this:
elastic-monitoring/
├── docker-compose.yml
└── config/
    ├── elasticsearch/
    │   └── elasticsearch.yml
    ├── kibana/
    │   └── kibana.yml
    └── metricbeat/
        └── metricbeat.yml
Step 2: Configuring Elasticsearch
Elasticsearch is the heart of your monitoring stack. Create config/elasticsearch/elasticsearch.yml with this configuration:
cluster.name: 'docker-monitoring-cluster'
network.host: 0.0.0.0
discovery.type: single-node

# Disable security for local development
# WARNING: Never use these settings in production!
xpack.security.enabled: false
This configuration disables Elasticsearch’s bootstrap checks to facilitate development environment setup but security should always be enabled for production deployments.
Step 3: Configuring Kibana
Kibana provides the visual interface where you’ll spend most of your time. Create config/kibana/kibana.yml:
server.name: kibana
server.host: '0.0.0.0'
elasticsearch.hosts: ['http://elasticsearch:9200']
monitoring.ui.container.elasticsearch.enabled: true
telemetry.enabled: false
telemetry.allowChangingOptInStatus: false
xpack.securitySolution.enabled: false
Notice we’re using elasticsearch:9200 as the host. When containers share a Docker network they can reach each other via service names instead of IP addresses. The extra settings silence the optional telemetry banners and keep the Security Solution plugin from enabling extra features you don’t need for this walk-through, which keeps the 9.2.x stack’s startup noise to a minimum. (Kibana still logs a TLS reminder because we’re intentionally running the stack over plain HTTP for local testing.)
Step 4: Configuring Metricbeat
Metricbeat will monitor both your host system and the Docker containers themselves. Create config/metricbeat/metricbeat.yml:
metricbeat.config.modules:
  path: ${path.config}/modules.d/*.yml
  reload.enabled: false

# Raise the doc field limit so docker/system modules don't trigger warnings
setup.template.settings:
  index.mapping.total_fields.limit: 20000

# System module - monitors host metrics
metricbeat.modules:
  - module: system
    period: 10s
    metricsets:
      - cpu
      - load
      - memory
      - network
      - process
      - process_summary
      - socket_summary
    processes: ['.*']

  - module: system
    period: 1m
    metricsets:
      - filesystem
      - fsstat
    processors:
      - drop_event.when.regexp:
          system.filesystem.mount_point: '^/(sys|cgroup|proc|dev|etc|host|lib|snap)($|/)'

  - module: docker
    period: 10s
    metricsets:
      - container
      - cpu
      - diskio
      - healthcheck
      - info
      - memory
      - network
    hosts: ['unix:///var/run/docker.sock']

# Output to Elasticsearch
output.elasticsearch:
  hosts: ['elasticsearch:9200']

# Kibana endpoint for setup
setup.kibana:
  host: 'kibana:5601'

# Logging configuration
logging.level: info
logging.to_files: false
logging.to_syslog: false

# Add Docker metadata to events
processors:
  - add_docker_metadata: ~
  - add_host_metadata: ~
The system module enables monitoring of host server metrics like CPU, load, memory, network, process, and filesystem statistics while the Docker module connects to the Docker daemon socket to collect container-related metrics.
Step 5: Creating the Docker Compose File
Now let’s tie everything together. Create your docker-compose.yml in the project root:
volumes:
  elasticsearch_data:
    driver: local

networks:
  elastic:
    driver: bridge

services:
  elasticsearch:
    image: docker.elastic.co/elasticsearch/elasticsearch:9.2.1
    container_name: elasticsearch
    environment:
      - discovery.type=single-node
      - ES_JAVA_OPTS=-Xms2g -Xmx2g
      - xpack.security.enabled=false
    volumes:
      - elasticsearch_data:/usr/share/elasticsearch/data
      - ./config/elasticsearch/elasticsearch.yml:/usr/share/elasticsearch/config/elasticsearch.yml:ro
    ports:
      - '9200:9200'
      - '9300:9300'
    networks:
      - elastic
    healthcheck:
      test: ['CMD-SHELL', 'curl -f http://localhost:9200 || exit 1']
      interval: 30s
      timeout: 10s
      retries: 5

  kibana:
    image: docker.elastic.co/kibana/kibana:9.2.1
    container_name: kibana
    volumes:
      - ./config/kibana/kibana.yml:/usr/share/kibana/config/kibana.yml:ro
    ports:
      - '5601:5601'
    networks:
      - elastic
    depends_on:
      elasticsearch:
        condition: service_healthy
    healthcheck:
      test: ['CMD-SHELL', 'curl -f http://localhost:5601/api/status || exit 1']
      interval: 30s
      timeout: 10s
      retries: 5

  metricbeat:
    image: docker.elastic.co/beats/metricbeat:9.2.1
    container_name: metricbeat
    user: root
    volumes:
      - ./config/metricbeat/metricbeat.yml:/usr/share/metricbeat/metricbeat.yml:ro
      - /var/run/docker.sock:/var/run/docker.sock:ro
      - /sys/fs/cgroup:/hostfs/sys/fs/cgroup:ro
      - /proc:/hostfs/proc:ro
      - /:/hostfs:ro
    environment:
      - ELASTICSEARCH_HOSTS=http://elasticsearch:9200
      - KIBANA_HOST=http://kibana:5601
    command: metricbeat -e --strict.perms=false --system.hostfs=/hostfs
    networks:
      - elastic
    depends_on:
      kibana:
        condition: service_healthy
Let’s break down some key points:
- Metricbeat runs as the root user to access system function calls for gathering host metrics
- We mount critical system directories like
/proc,/sys/fs/cgroup, and the Docker socket - The Metricbeat command uses the long-form flags required in 9.x (
--strict.perms=false --system.hostfs=/hostfs) - Memory allocation is set to 2GB for Elasticsearch, which is adequate for testing but should be increased for production use
- Health checks ensure services start in the correct order
Step 6: Launching Your Monitoring Stack
Start everything with a single command:
docker compose up -dWatch the logs to ensure everything starts properly:
docker compose logs -fYou should see messages indicating that:
- Elasticsearch has started and formed a cluster
- Kibana has connected to Elasticsearch
- Metricbeat is collecting and shipping metrics
Give it about 2-3 minutes for all services to fully initialize. The setup process generates certificates and configures passwords automatically. Because security is disabled in this walkthrough, you won’t be prompted for passwords and all endpoints are exposed over HTTP only. This is fine for a local lab, but be sure to enable TLS and authentication for anything beyond that.
Here are a few quick validation commands to make sure everything looks healthy before you jump into Kibana:
# Confirm containers and health checks
docker compose ps

# Basic Elasticsearch availability check
curl -s http://localhost:9200/_cluster/health | jq '.status'

# Inspect data streams (Metricbeat should create .ds-metricbeat-*)
curl -s 'http://localhost:9200/_cat/indices/.ds-metricbeat-*?v'

# Verify Kibana status JSON
curl -s http://localhost:5601/api/status | jq '.status.overall.summary'
Step 7: Accessing Kibana and Verifying Data
Open your browser and navigate to:
http://localhost:5601You should see the Kibana interface load. Now let’s verify that metrics are flowing:
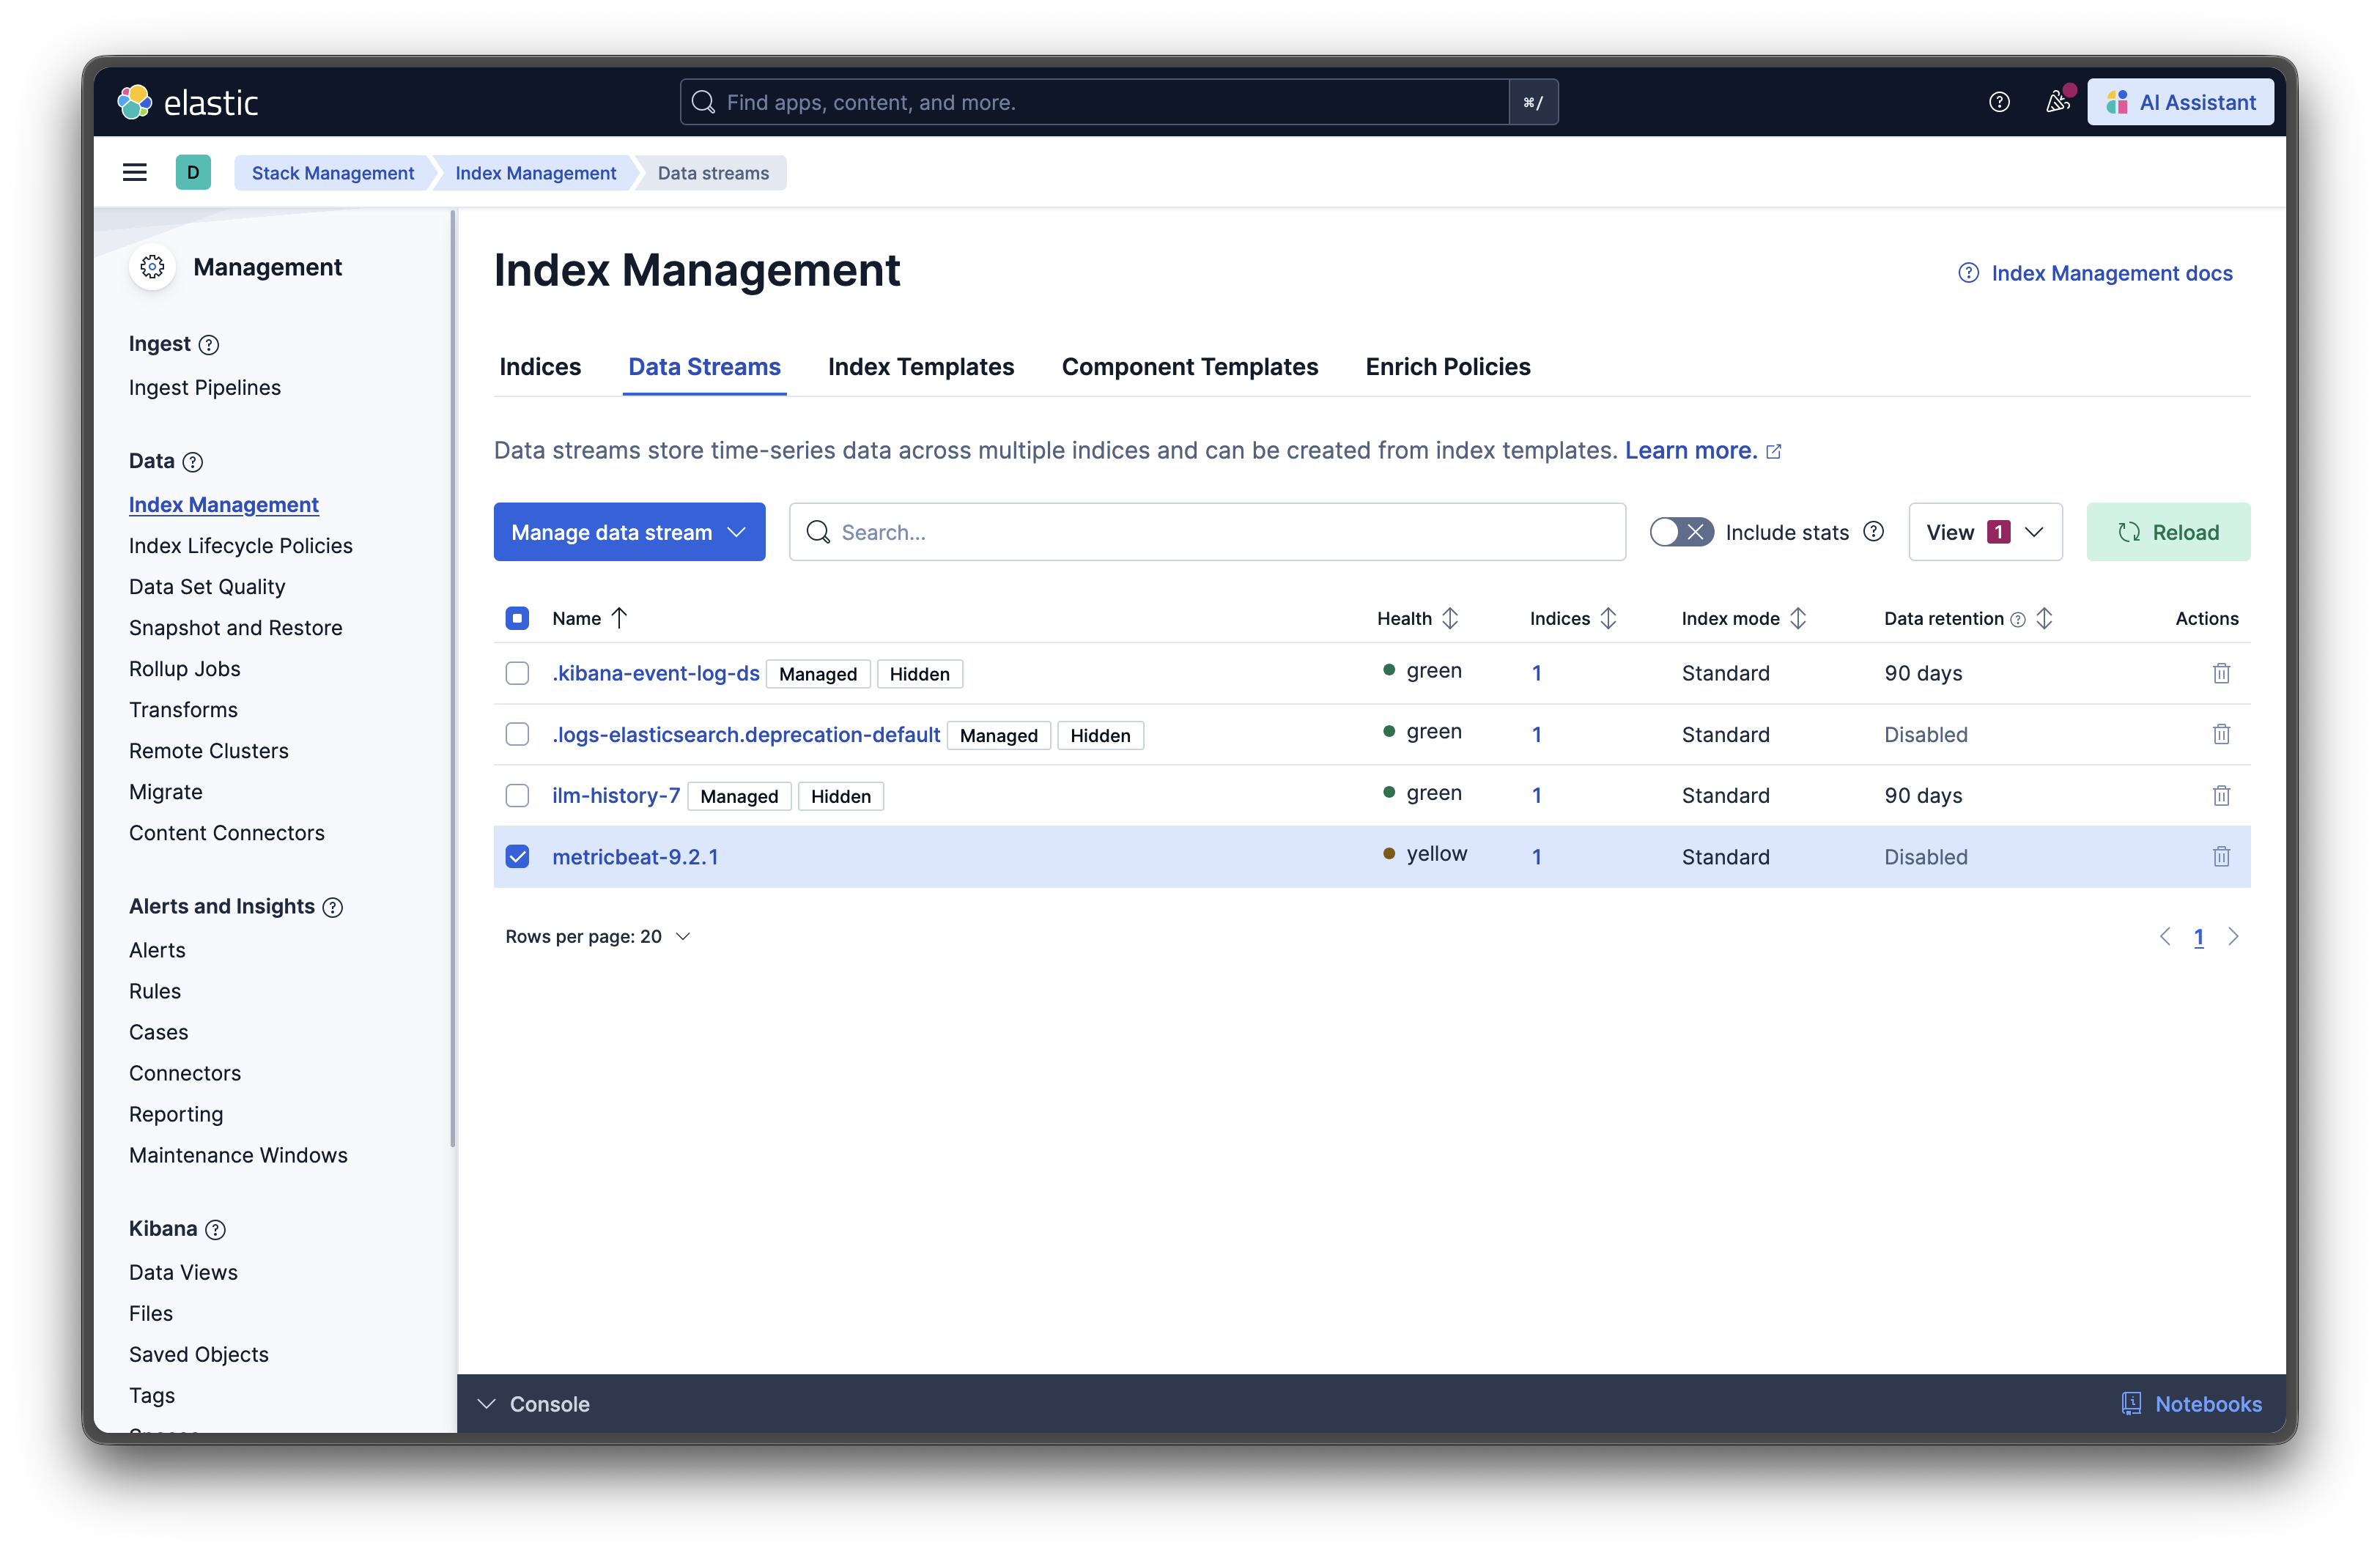
Check the data streams: Navigate to Stack Management → Index Management → Data Streams. You should see metricbeat-* data streams appearing.
Step 8: Setting Up Pre-Built Dashboards
Metricbeat comes with pre-built dashboards. Set them up with this command:
docker exec metricbeat metricbeat setup --dashboardsThis command loads dozens of professionally designed dashboards into Kibana. Now navigate to Analytics → Dashboard in Kibana and look for dashboards like:
- [Metricbeat System] Overview - A comprehensive view of your system’s health
- [Metricbeat Docker] Overview - Container-specific metrics and statistics
- [Metricbeat System] Host Overview - Detailed host-level performance data
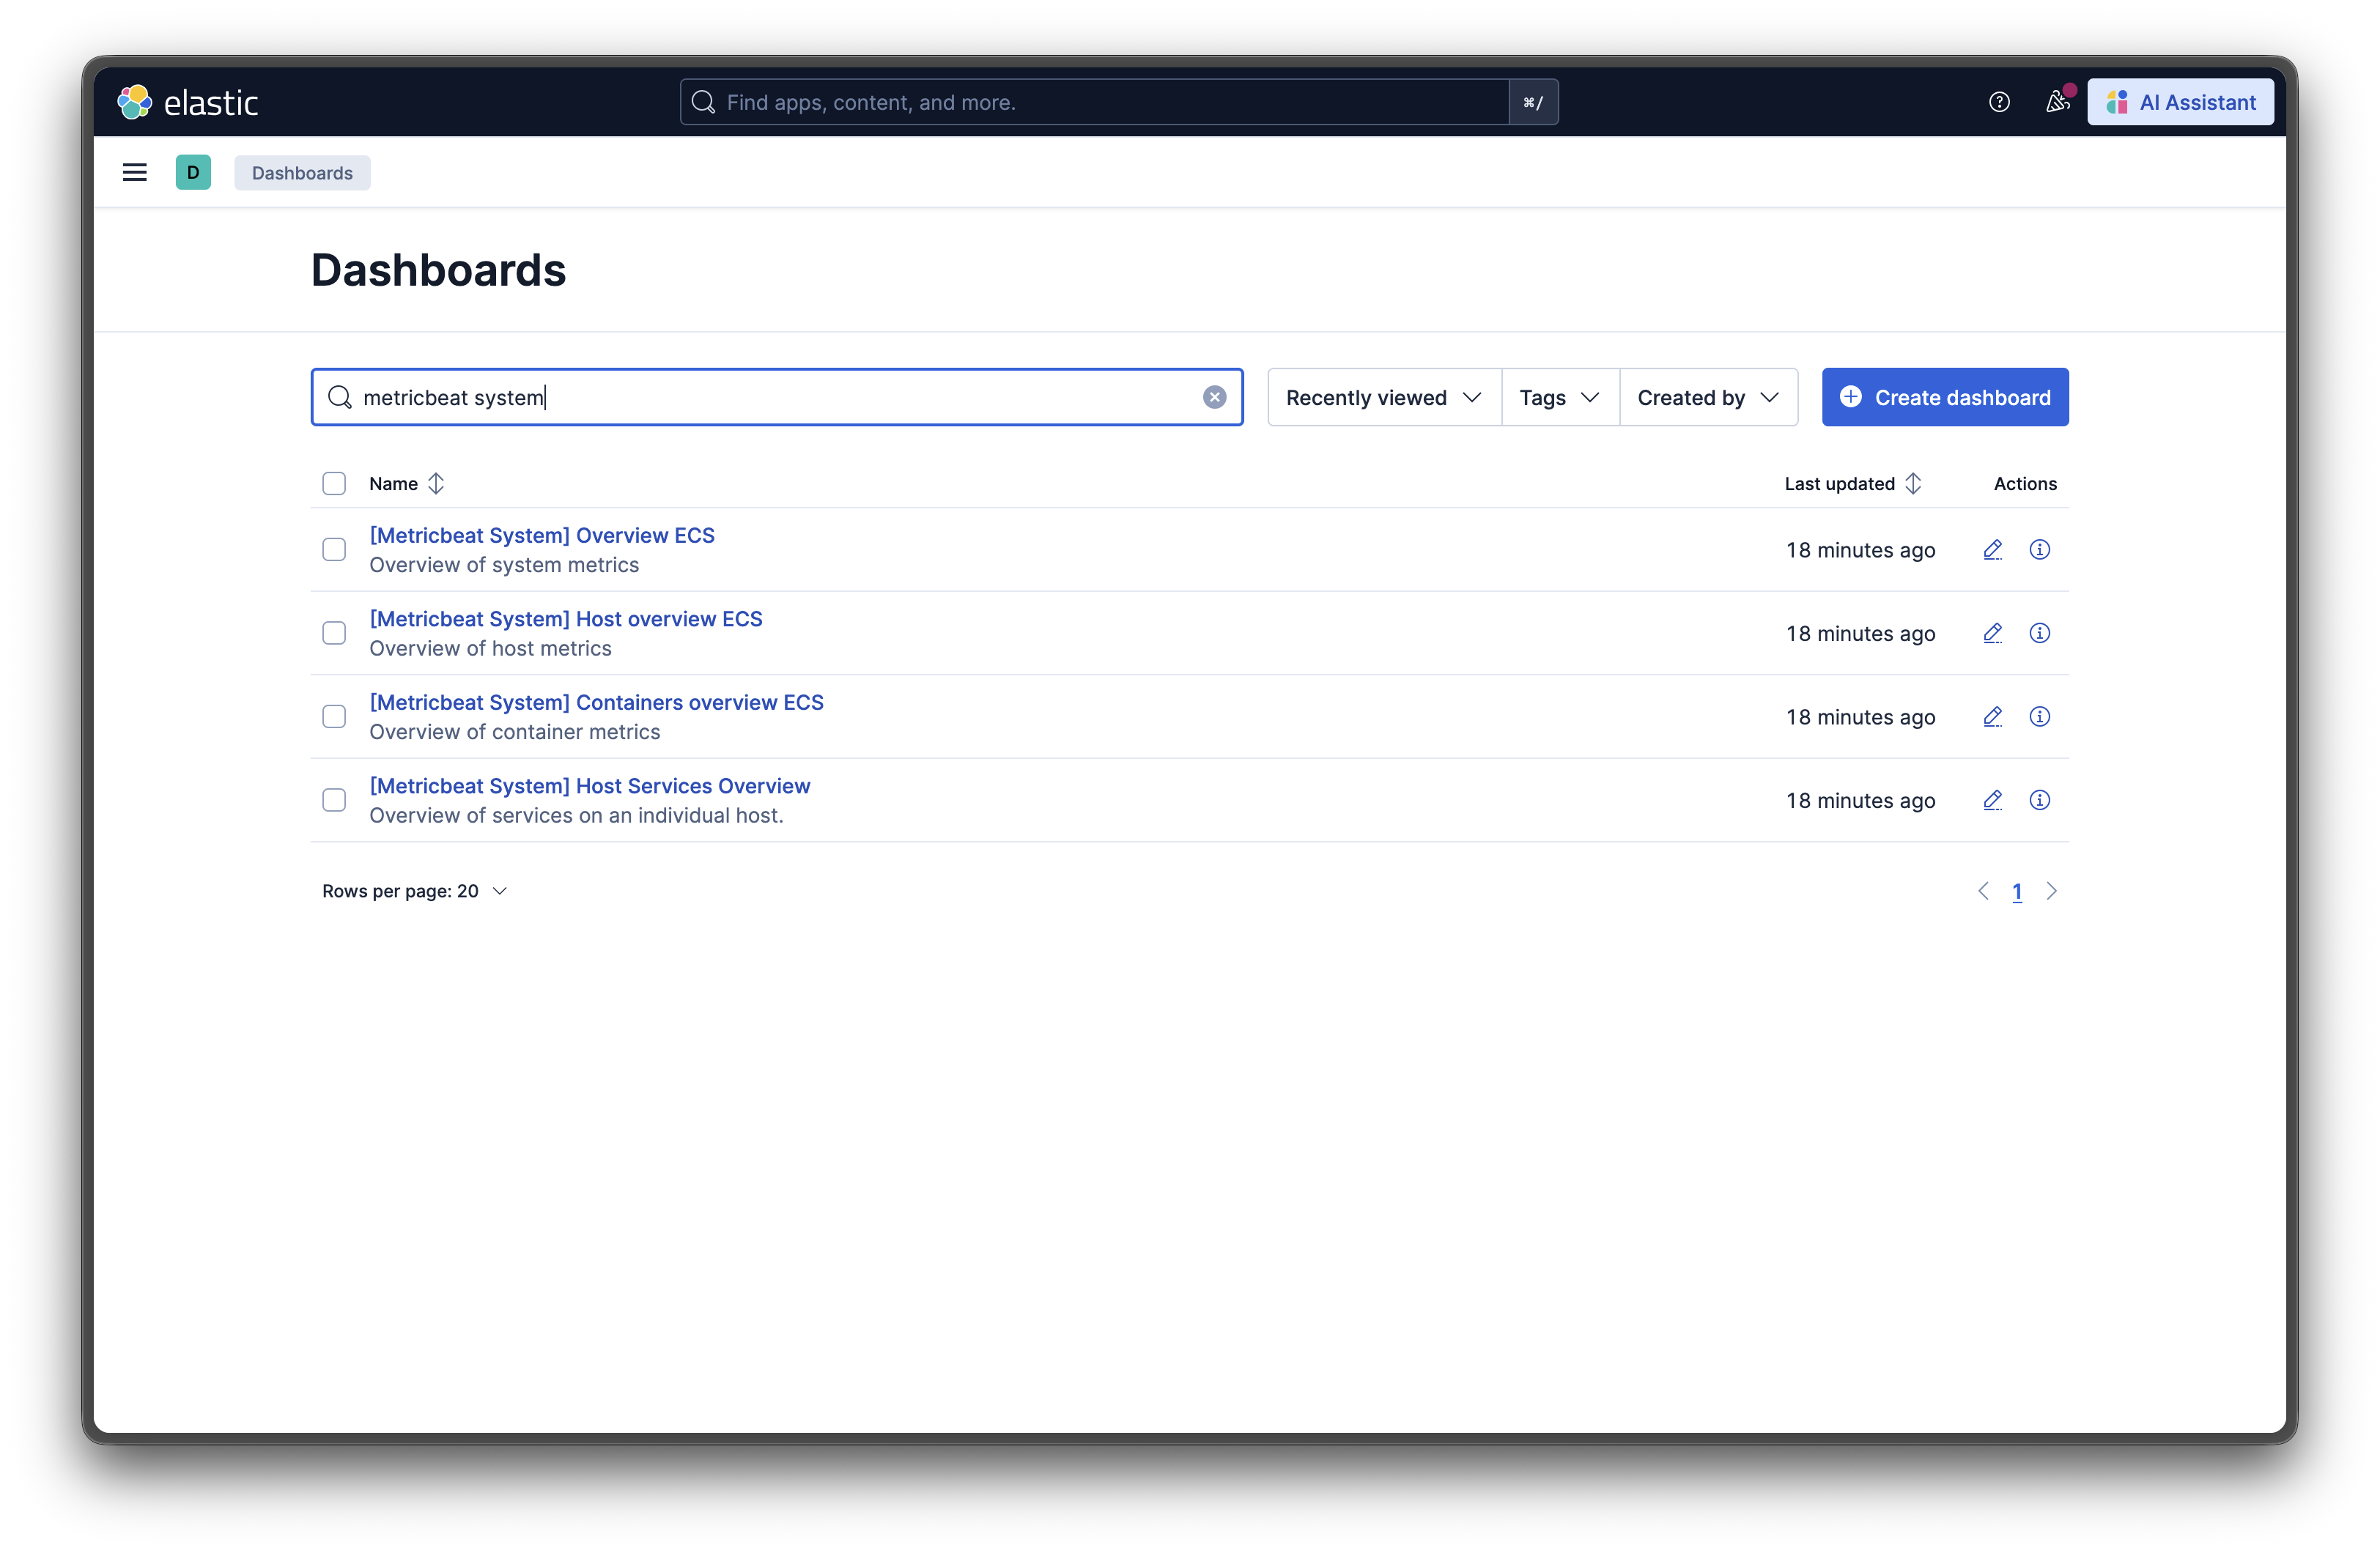
I’m not sure why they are all marked “ECS” but the data still loads even though these are not AWS ECS hosts.
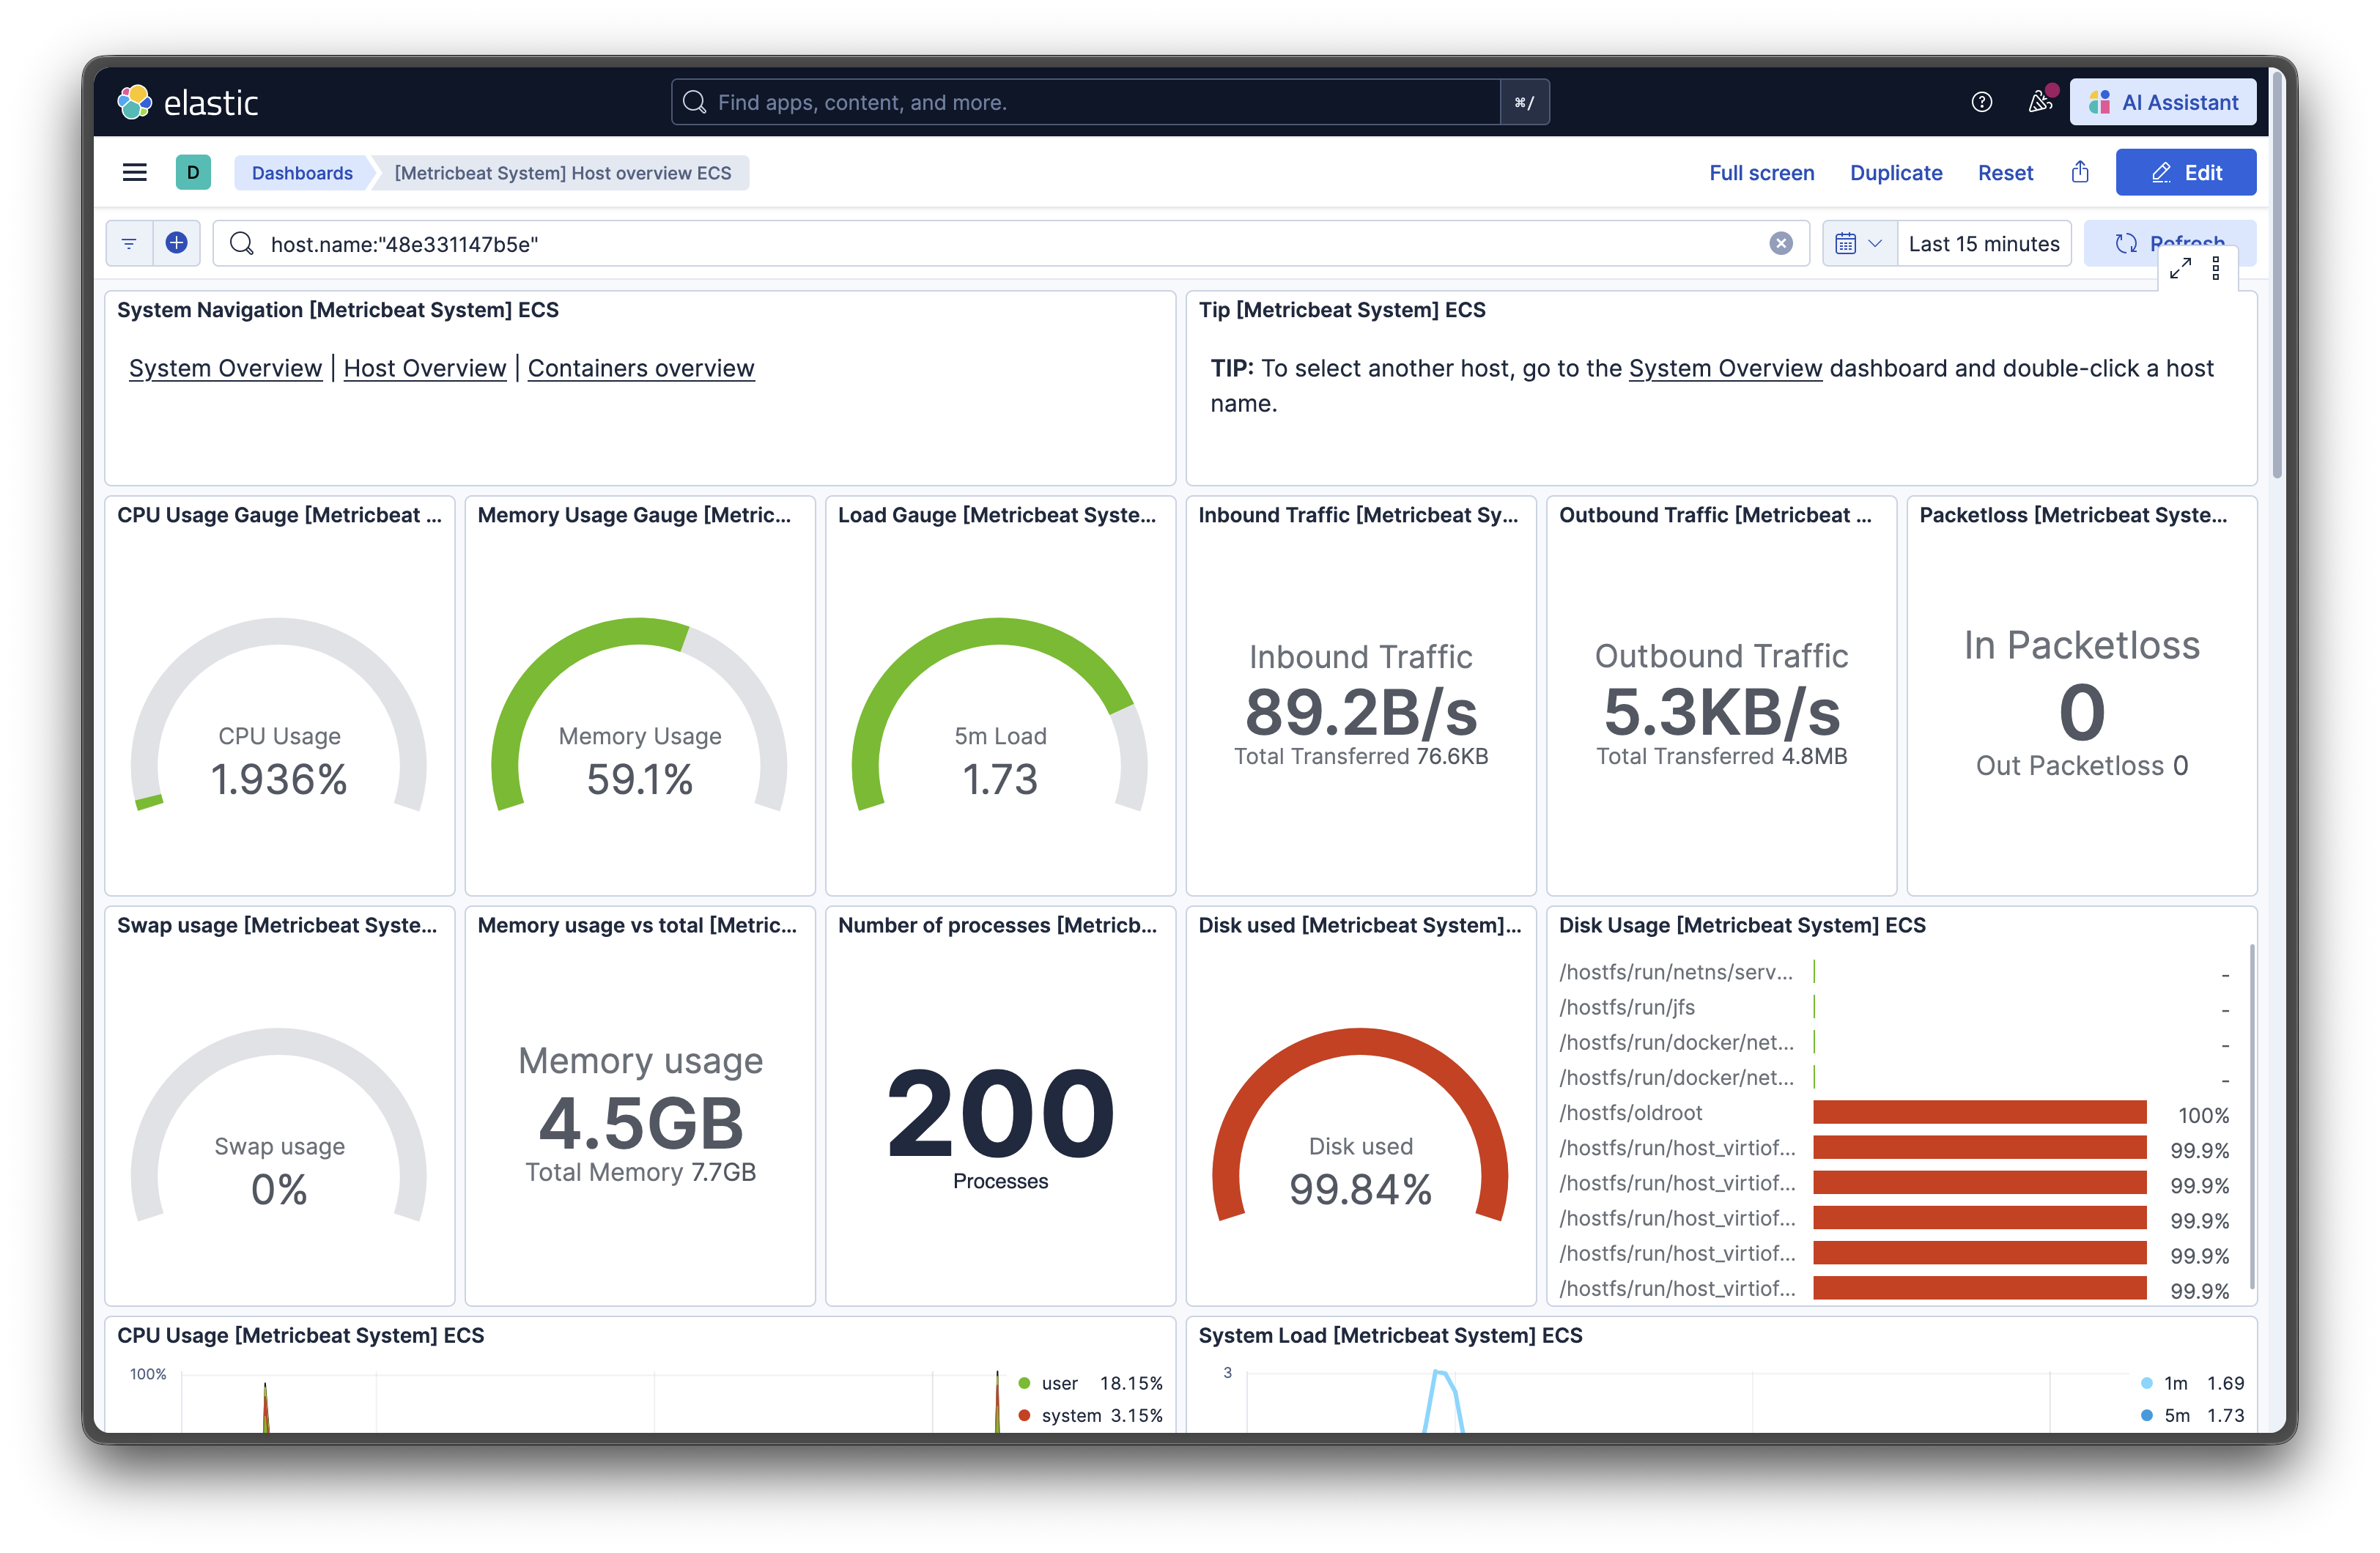
Click into the System Overview dashboard, and you’ll see:
- Real-time CPU usage graphs
- Memory consumption trends
- Network I/O statistics
- Top processes by resource usage
- Disk I/O performance
Step 9: Exploring Your Monitoring Data
Now that data is flowing, let’s explore what you can do:
Monitor System Performance
The system module tracks metrics including CPU load, memory usage, network statistics, running processes, and filesystem usage. Watch these metrics to:
- Identify CPU-hungry processes
- Track memory leaks over time
- Monitor network bandwidth consumption
- Spot disk space issues before they become critical
Track Docker Containers
The Docker module collects container metrics including CPU usage, memory limits, disk I/O activity, and network statistics. The pre-made dashboards help:
- Identifying misbehaving containers
- Right-sizing container resource limits
- Monitoring container health status
- Tracking container lifecycle events
Create Custom Visualizations
Don’t like the default dashboards? Navigate to Analytics → Visualize Library → Create visualization and choose from:
- Line charts for time-series data
- Pie charts for resource distribution
- Data tables for detailed metrics
- Gauges for current values
- Heat maps for patterns over time
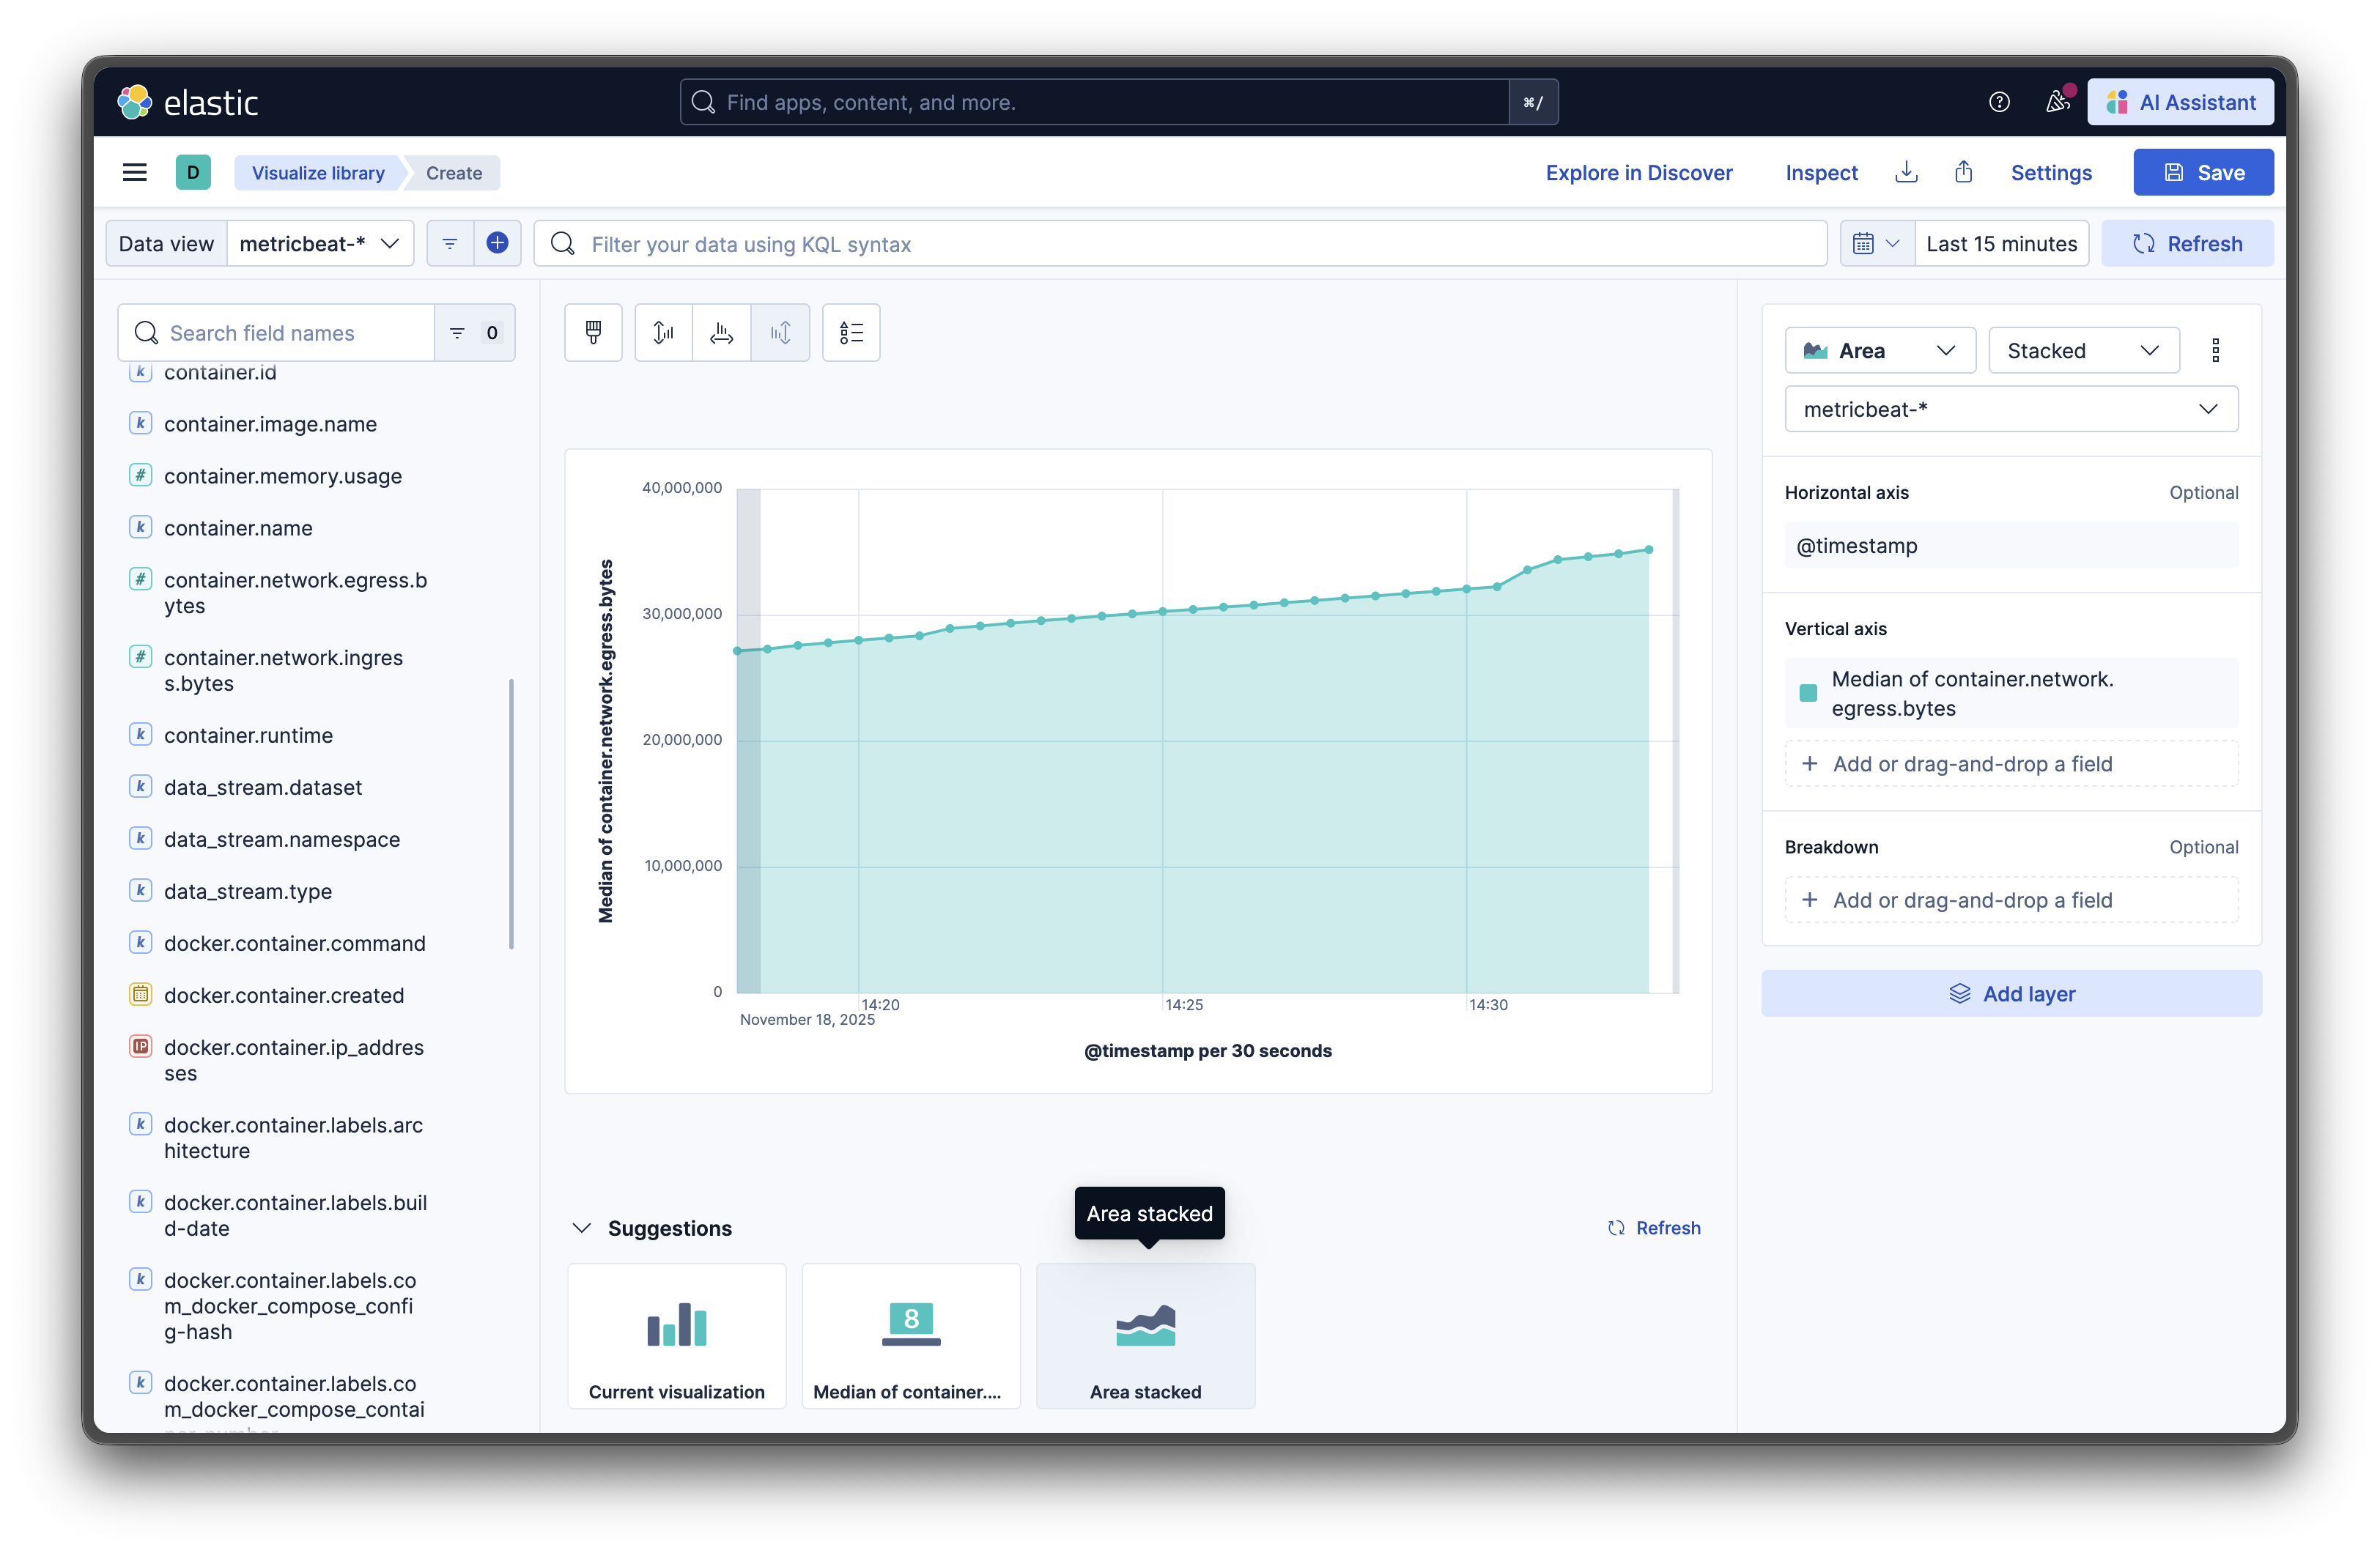
(This may be challenging to do if you are not familiar with the available metrics.)
Step 10: Setting Up Alerts (Optional but Recommended)
Monitoring is great, but alerts are better. You can set up out-of-the-box rules in Stack Monitoring to get notified when things go wrong:
- Navigate to Stack Management → Rules
- Click Create rule
- Choose a rule type like “Metric threshold”
- Set conditions (e.g., CPU usage > 80% for 5 minutes)
- Configure actions (email, Slack, webhook, etc.)
Now you’ll get notified before issues escalate into outages.
Note: you need to have security enabled to set up alerts (to protect credentials or webhoook secrets).
Troubleshooting Common Issues
Elasticsearch won’t start
Problem: Container exits immediately
Solution: Check that vm.max_map_count is set correctly:
sysctl vm.max_map_countIf it shows less than 262144, set it again and restart Docker.
No metrics appearing in Kibana
Problem: Dashboards are empty Solution:
- Verify Metricbeat is running:
docker compose ps - Check Metricbeat logs:
docker compose logs metricbeat - Ensure Elasticsearch is healthy:
curl http://localhost:9200/_cluster/health
High memory usage
Problem: System becomes sluggish
Solution: Reduce memory allocation by adjusting the ES_JAVA_OPTS environment variable in docker-compose.yml from -Xms2g -Xmx2g to -Xms1g -Xmx1g.
Kibana logs a TLS/HTTP warning
Problem: docker compose logs kibana prints TLS is not enabled, or the HTTP protocol is set to HTTP/1.
Solution: Kibana 9.x prefers HTTPS with HTTP/2. For local labs you can safely ignore the warning, but for shared environments enable TLS (see Secure the Elastic Stack) or place the UI behind a reverse proxy that terminates HTTPS.
Elasticsearch reports “Behavioral Analytics is deprecated”
Problem: docker compose logs elasticsearch shows Behavioral Analytics is deprecated and will be removed.
Solution: Kibana 9.2.x automatically cleans up default Behavioral Analytics collections during startup, which triggers this deprecation log. No action is required for local testing; it will disappear automatically once Elastic removes the legacy API.
Metricbeat prints “permission denied” for process metrics
Problem: The Metricbeat container logs Error fetching data for metricset system.process… most likely a "permission denied" error.
Solution: That happens on macOS/Windows hosts where Docker limits visibility into host PIDs. For local experiments you can ignore the partial metrics. In Linux environments, add cap_add: ["SYS_PTRACE"] (and optionally security_opt: ["apparmor:unconfined"]) to the Metricbeat service in docker-compose.yml so the process module can read /proc without errors.
Taking It Further
You now have a fully functional monitoring system. Here are some ways to enhance it:
Add Filebeat for Log Collection
Filebeat can grab logs from services and forward them to Elasticsearch, giving you both metrics and logs in one place.
Enable Security
For production use, enable X-Pack security features to protect your data with authentication and encryption.
Scale to Multiple Nodes
The Elastic stack can be extended into a multi-node cluster for high availability and better performance.
Add APM for Application Monitoring
If you have created a custom web application, Elastic APM provides deeper visibility into your applications with correlated traces, logs, and metrics.
Cleaning Up
When you’re done experimenting or need to start fresh:
# Stop all containers
docker compose down

# Remove all data volumes (warning: this deletes all collected metrics!)
docker compose down -v
Conclusion
The Elastic Stack gives you enterprise level observability with the simplicity of container orchestration.
Whether you’re tracking down a memory leak, optimizing container resource allocation, or just keeping an eye on system health, you now have the tools to do it effectively. Metricbeat provides a flexible and powerful way to monitor your entire Docker environment, from individual containers to host performance.
Everything we’ve built here is portable. You can commit your configuration files to Git, share them with your team, and spin up identical monitoring stacks anywhere Docker runs.
Next I am going to take a look at the new Elastic agent which can be an alternative app to collect metrics and logs and store them in the Elastic stack (self-hosted or cloud)
Resources and Further Reading:
- Official Elastic Stack Documentation
- Metricbeat Reference Guide
- Docker Compose Documentation
- Elasticsearch Configuration Guide
New disclaimer I am adding: I used an LLM to help create this post but afterwards I spent more than an hour editing it to the final form.