Shipping Kubernetes pod, journal, and event logs to Loki with Grafana Alloy
I run a single Loki instance in the homelab and I want everything in the cluster to land in it. Pod logs are the obvious source, but I also want the systemd journal from the underlying nodes (kubelet, containerd, sshd, network errors) and the stream of Kubernetes events that the API server emits. Three distinct sources, one collector, one place to query.
Grafana Alloy is the collector. It is the modern replacement for Promtail, configured with the Alloy River language, which is much closer to a real configuration language than YAML strings. The official Helm chart ships it as a DaemonSet, which means one Alloy pod per node.
This post walks through a greenfield install of Alloy on Kubernetes via Argo CD, with all three log streams turned on. I am assuming you already have a Kubernetes cluster, an Argo CD app repo, and a Loki endpoint. If you are starting earlier in the stack, I have previous posts on deploying Kubernetes with Kubespray, managing Helm apps with Argo CD app-of-apps, and upgrading or installing Loki 3. I also have an earlier Promtail to Alloy Kubernetes migration post and a Linux Alloy setup post if you want the surrounding context.
How it works
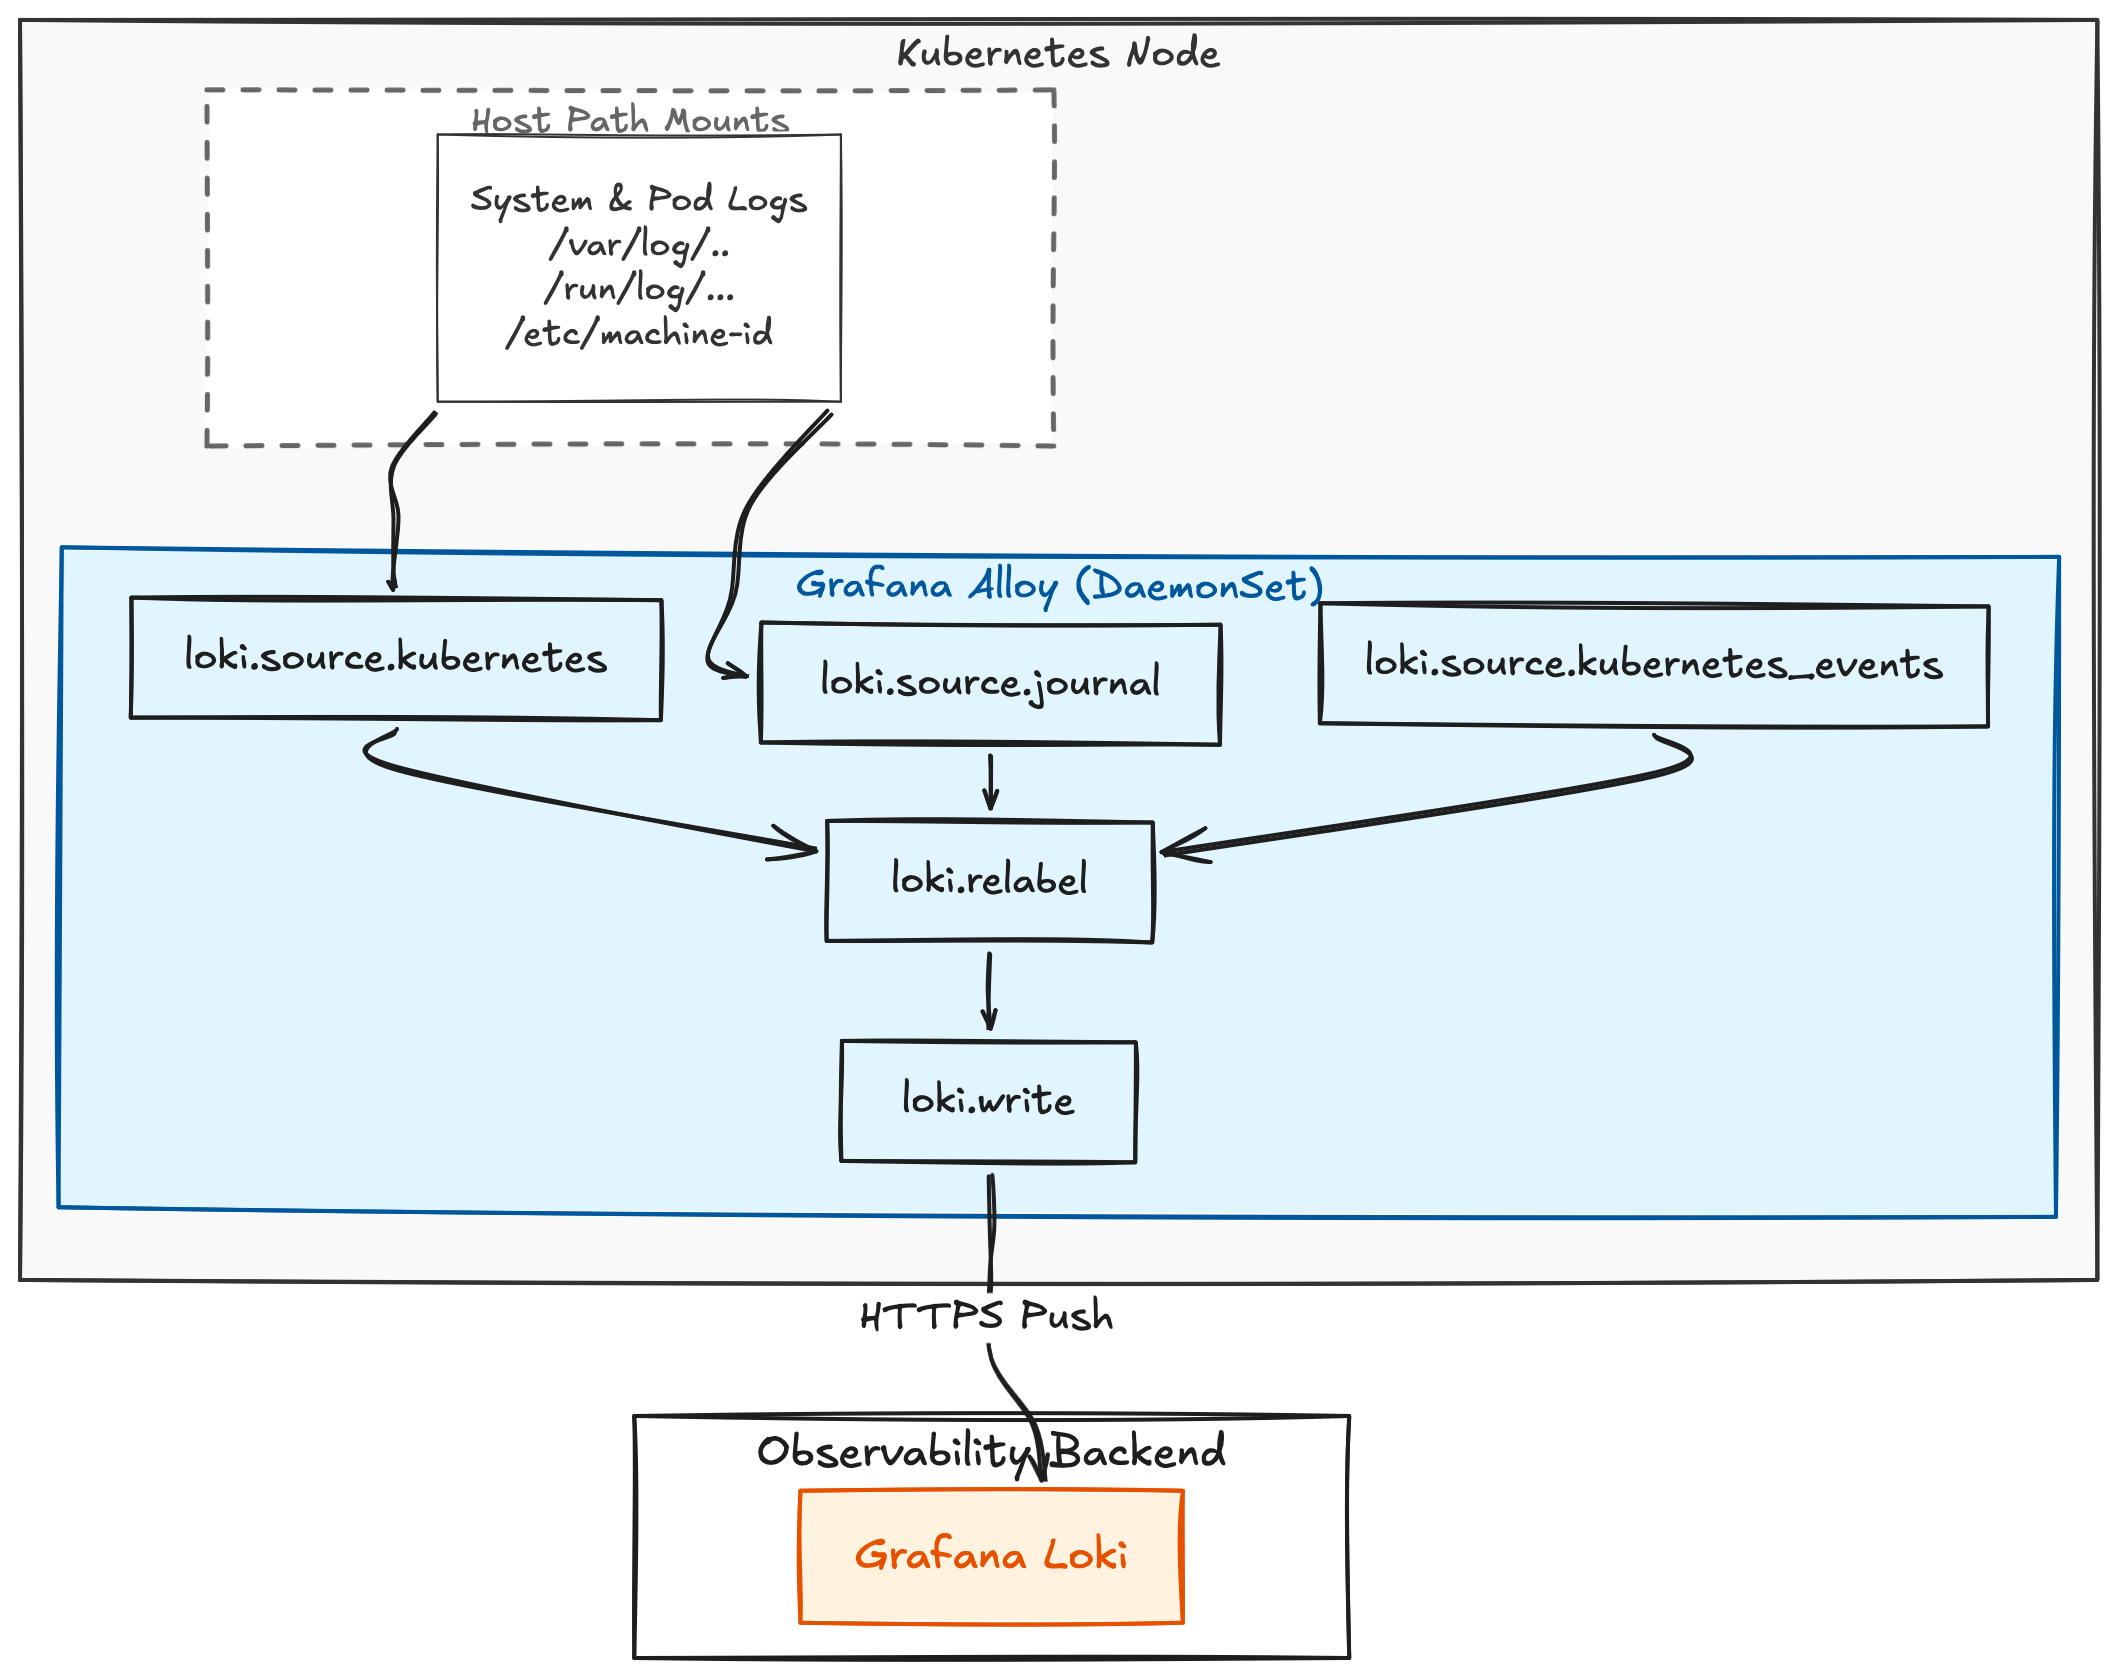
The DaemonSet means each node sees its own pods and its own journal. The Kubernetes events source uses a leader-elected watch so only one pod in the cluster ends up forwarding the event stream.
The Argo CD application
I deploy everything through Argo CD using the multi-source pattern: the upstream chart, a values file in this repo, and sometimes extra templates.
# argo-apps/apps/alloy/app.yaml
apiVersion: argoproj.io/v1alpha1
kind: Application
metadata:
  name: alloy
  namespace: argocd
spec:
  destination:
    namespace: monitoring
    server: https://kubernetes.default.svc
  project: default
  sources:
    - chart: alloy
      repoURL: https://grafana.github.io/helm-charts
      targetRevision: 1.8.0
      helm:
        releaseName: alloy
        valueFiles:
          - $values/argo-apps/apps/alloy/values.yaml
    - repoURL: https://git.example.com/me/manifests.git
      targetRevision: main
      ref: values
  syncPolicy:
    automated:
      prune: true
      selfHeal: true
    syncOptions:
      - CreateNamespace=true
      - ServerSideApply=true
Argo CD reconciles the chart against the values file in the Git repo. Bumping the chart is a one-line change to targetRevision, and the values stay in their own file where they diff cleanly under code review. If you are not using Argo CD, the same values can be passed to Helm with helm install alloy grafana/alloy --namespace monitoring --values values.yaml.
Host mounts for the journal
The Alloy chart already knows how to mount /var/log from the host (alloy.mounts.varlog: true), which covers the persistent journal at /var/log/journal. Two extra mounts handle the rest:
/run/log/journal: the volatile journal, used when the host is configured for in-memory journaling/etc/machine-id:libsystemdreads this to identify the host and locate the matching per-host journal directory
Both are declared as host volumes on the controller and mounted into the Alloy container:
# argo-apps/apps/alloy/values.yaml (top of file)
controller:
  type: daemonset
  volumes:
    extra:
      - name: runlog
        hostPath:
          path: /run/log/journal
      - name: machine-id
        hostPath:
          path: /etc/machine-id

alloy:
  mounts:
    varlog: true
    extra:
      - name: runlog
        mountPath: /run/log/journal
        readOnly: true
      - name: machine-id
        mountPath: /etc/machine-id
        readOnly: true
controller.type: daemonset is the chart default but I like to keep it explicit. The DaemonSet is the load-bearing piece: per-node Alloy means per-node pod logs, per-node journal, and a per-node candidate for the events leader election.
The River configuration
The chart accepts the entire Alloy River config as a string under alloy.configMap.content. I keep it in the values file alongside the mounts. The full config has three independent pipelines that all forward to one shared loki.write sink.
Loki output
logging {
  level  = "info"
  format = "logfmt"
}

loki.write "default" {
  endpoint {
    url = "https://loki.example.com/loki/api/v1/push"
  }
}
Every other component forwards into loki.write.default.receiver.
Pod logs (per-node only)
discovery.kubernetes "pod" {
  role = "pod"
  selectors {
    role  = "pod"
    field = "spec.nodeName=" + coalesce(sys.env("HOSTNAME"), constants.hostname)
  }
}

discovery.relabel "pod_logs" {
  targets = discovery.kubernetes.pod.targets
  rule {
    source_labels = ["__meta_kubernetes_namespace"]
    action        = "replace"
    target_label  = "namespace"
  }
  rule {
    source_labels = ["__meta_kubernetes_pod_name"]
    action        = "replace"
    target_label  = "pod"
  }
  rule {
    source_labels = ["__meta_kubernetes_pod_container_name"]
    action        = "replace"
    target_label  = "container_name"
  }
  rule {
    source_labels = ["__meta_kubernetes_pod_label_app_kubernetes_io_name"]
    action        = "replace"
    target_label  = "app"
  }
  rule {
    source_labels = ["__meta_kubernetes_namespace", "__meta_kubernetes_pod_container_name"]
    action        = "replace"
    target_label  = "job"
    separator     = "/"
    replacement   = "$1"
  }
  rule {
    source_labels = ["__meta_kubernetes_pod_uid", "__meta_kubernetes_pod_container_name"]
    action        = "replace"
    target_label  = "__path__"
    separator     = "/"
    replacement   = "/var/log/pods/*$1/*.log"
  }
  rule {
    source_labels = ["__meta_kubernetes_pod_container_id"]
    action        = "replace"
    target_label  = "container_runtime"
    regex         = "^(\\S+):\\/\\/.+$"
    replacement   = "$1"
  }
}

loki.source.kubernetes "pod_logs" {
  targets    = discovery.relabel.pod_logs.output
  forward_to = [loki.process.pod_logs.receiver]
}

loki.process "pod_logs" {
  stage.static_labels {
    values = {
      cluster = "homelab",
    }
  }
  forward_to = [loki.write.default.receiver]
}
The selectors block on discovery.kubernetes is the important bit. Without it, every Alloy pod tries to scrape every pod in the cluster, and you end up with N copies of every log line plus a “too many open files” error from each Alloy. Filtering by spec.nodeName against the pod’s own HOSTNAME env var means each Alloy only watches its own node.
The relabel rules promote the namespace, pod name, container name, the app.kubernetes.io/name label, and the container runtime to first-class Loki labels. They also synthesize the __path__ label so the Kubernetes log source can find the log file for each container.
Node systemd journal
discovery.relabel "journal" {
  targets = []
  rule {
    source_labels = ["__journal__systemd_unit"]
    target_label  = "unit"
  }
  rule {
    source_labels = ["__journal__hostname"]
    target_label  = "hostname"
  }
  rule {
    source_labels = ["__journal_priority_keyword"]
    target_label  = "level"
  }
}

loki.source.journal "node_journal" {
  max_age       = "12h"
  path          = "/var/log/journal"
  relabel_rules = discovery.relabel.journal.rules
  labels        = {
    job     = "node/journal",
    cluster = "homelab",
  }
  forward_to = [loki.write.default.receiver]
}
loki.source.journal reads via libsystemd, which is why we mounted /var/log/journal, /run/log/journal, and /etc/machine-id on the pod. Pointing path at /var/log/journal is enough; if a host only has the volatile journal, libsystemd falls back to /run/log/journal automatically.
The relabel ruleset turns three useful journal fields into Loki labels:
unit: the systemd unit name, for examplekubelet.serviceorsshd.servicehostname: the source hostlevel: the syslog priority keyword (info,warning,err, …)
Set max_age = "12h" to bound how far back Alloy will read on first start. Without it, a brand-new pod will try to ship the entire historical journal, which is rarely what you want.
Cluster events
loki.source.kubernetes_events "cluster_events" {
  job_name   = "integrations/kubernetes/eventhandler"
  log_format = "logfmt"
  forward_to = [loki.process.cluster_events.receiver]
}

loki.process "cluster_events" {
  stage.static_labels {
    values = {
      cluster = "homelab",
    }
  }
  stage.labels {
    values = {
      kubernetes_cluster_events = "job",
    }
  }
  forward_to = [loki.write.default.receiver]
}
loki.source.kubernetes_events watches the API server’s event stream. Every Alloy pod runs this, but they coordinate via a leader-elected lease. If the leader pod goes away another picks up the lease.
Verify
After Argo CD syncs, the DaemonSet should be running everywhere:
kubectl -n monitoring get ds alloy
kubectl -n monitoring logs -l app.kubernetes.io/name=alloy --tail=20
Then in Grafana, point a Loki data source at the same URL Alloy writes to and try a few queries:
# Everything from this cluster
{cluster="homelab"}
# Just node journal entries
{job="node/journal"}
# Kubelet on a single node
{job="node/journal", unit="kubelet.service", hostname="worker-01"}
# Pod logs from a namespace
{namespace="apps"}
# All Kubernetes events
{kubernetes_cluster_events="job"}
# Errors only, regardless of source
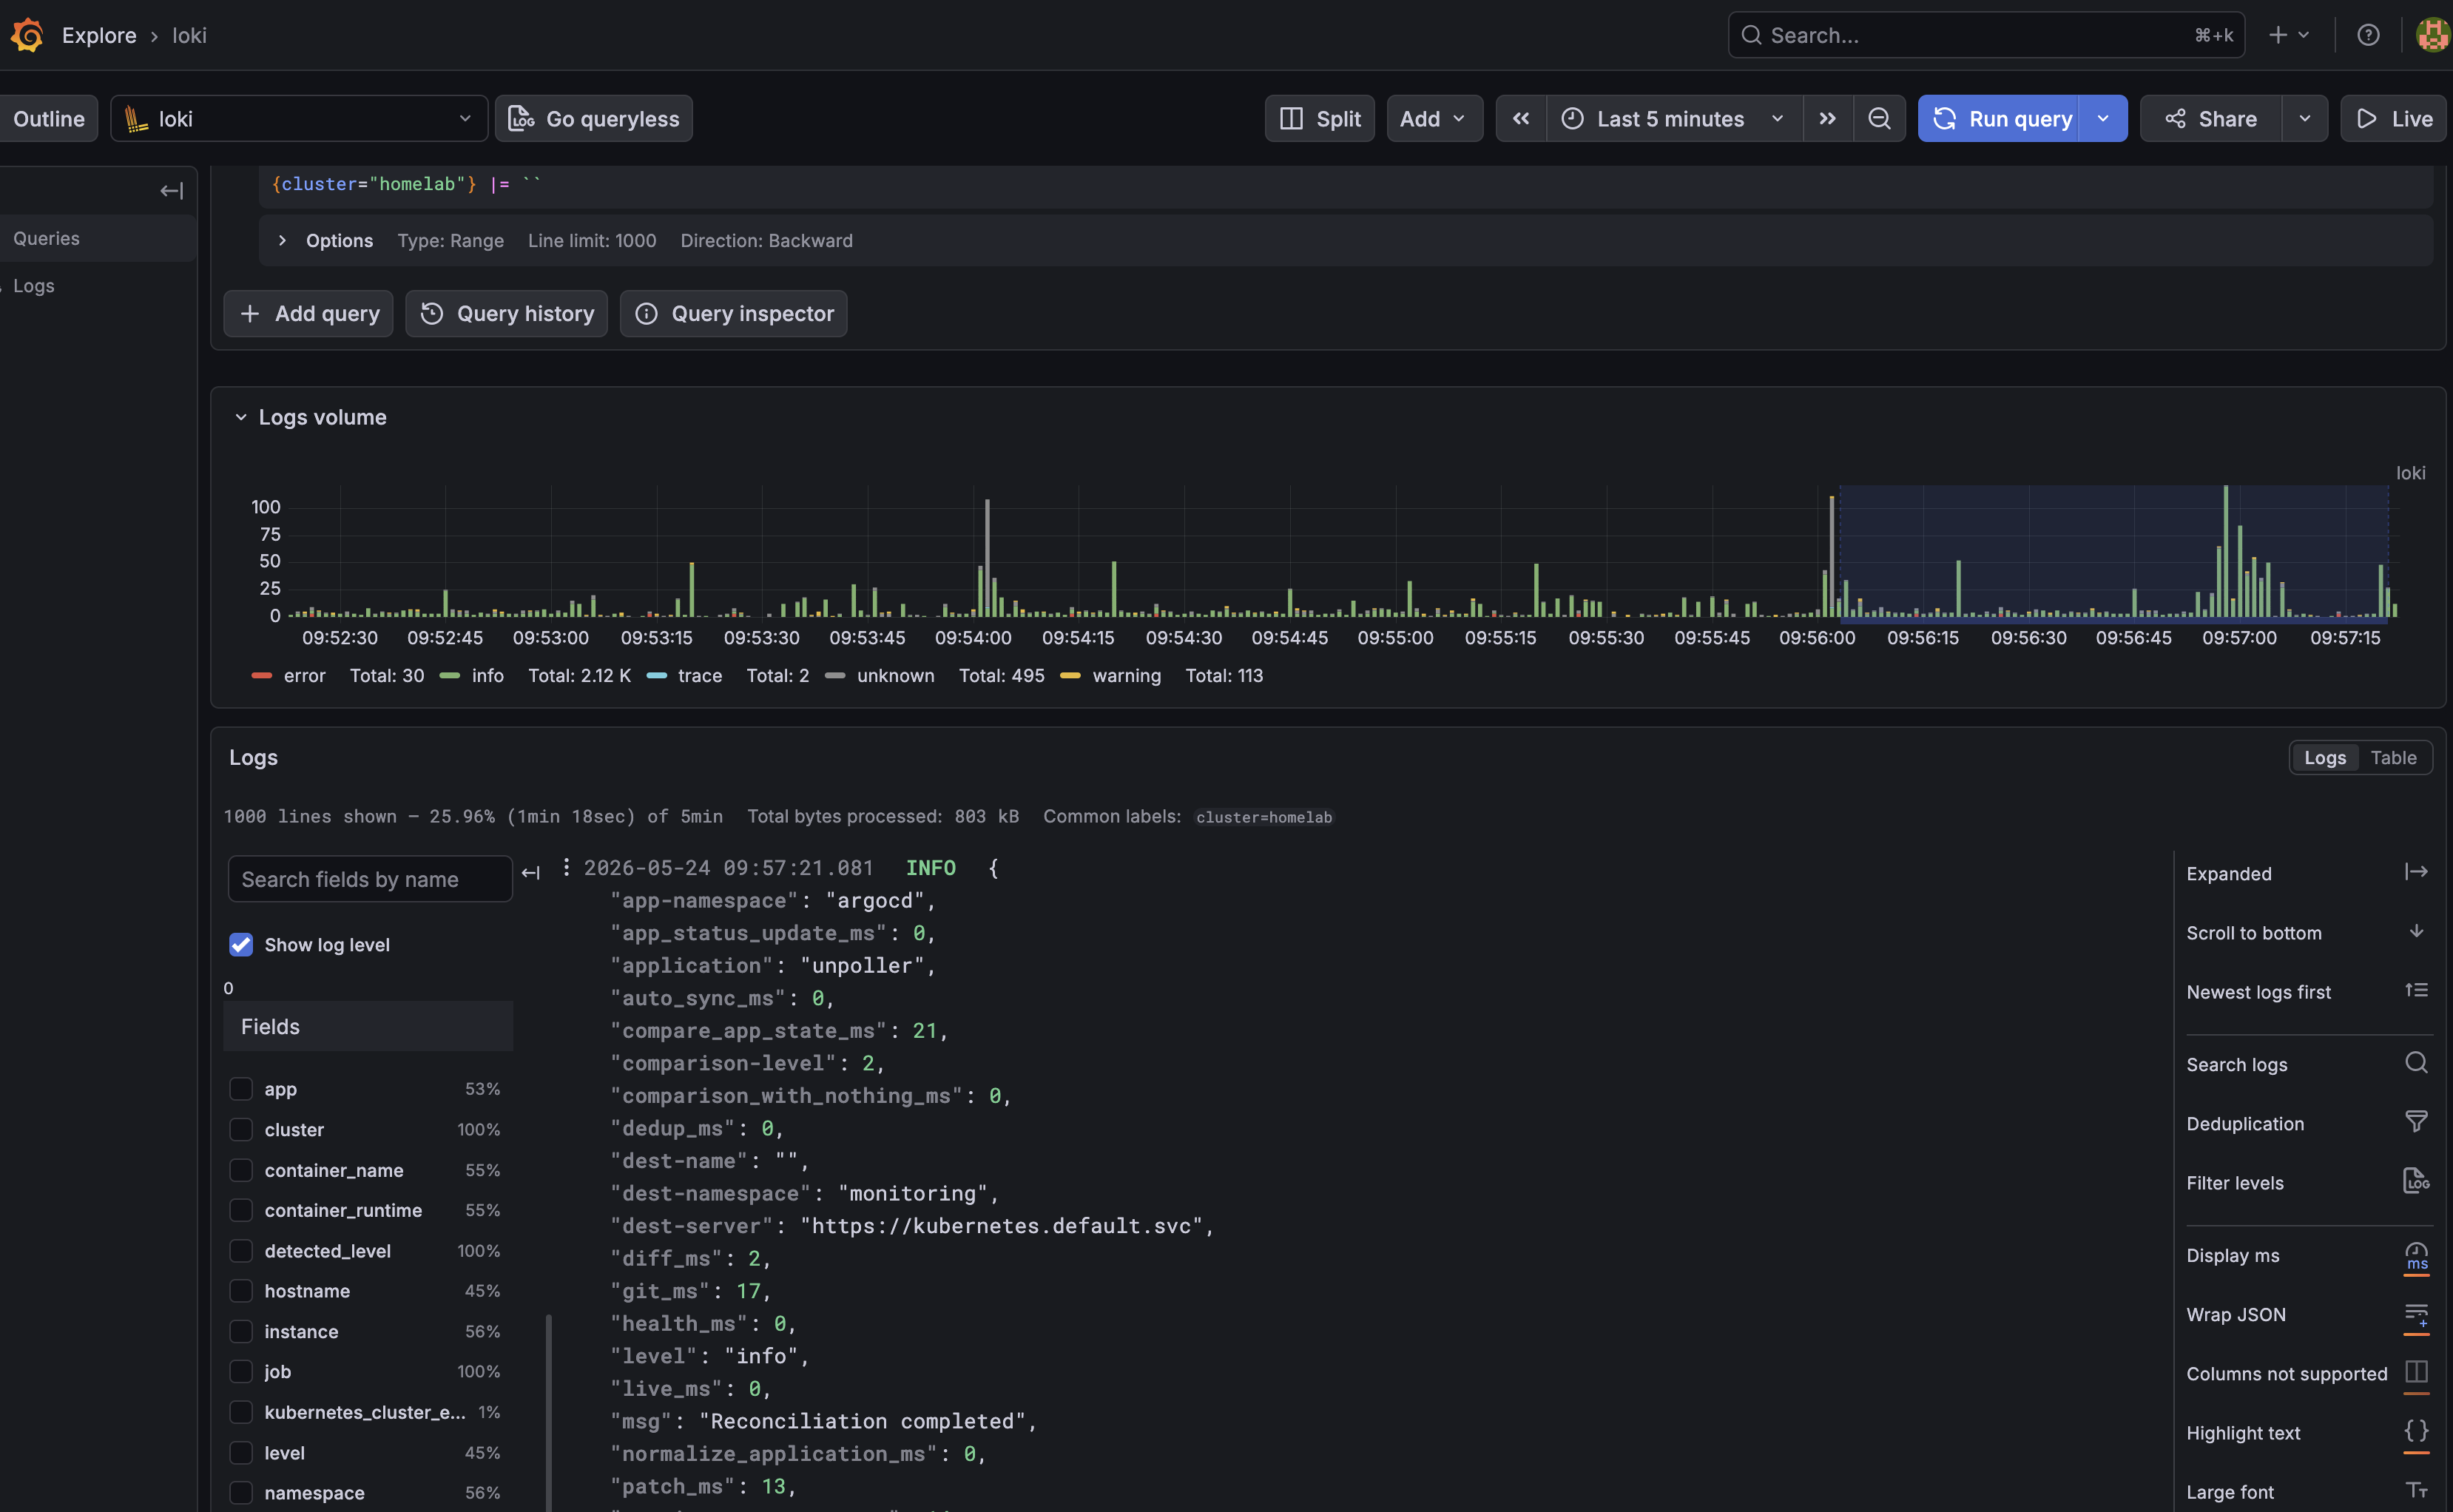
{cluster="homelab"} |= "error" | level=~"err|warning"The {cluster="homelab"} query is my “is anything happening” smoke test; if it returns lines from all three sources (pod_logs, node/journal, kubernetes_cluster_events), the pipeline is healthy end to end.
Closing thoughts
There are tradeoffs compared to Promtail, but Promtail is deprecated. Alloy is heavier than Promtail in memory, and the River language has a learning curve if you have only ever used YAML. But for any cluster where I want pod logs, host logs, and events in one place, this is the lowest-effort way to get there.
One practical note: this kind of configuration is a good fit for AI coding agents. If you give an agent an example like this post, it can usually help adapt the labels, Loki endpoint, namespace, and chart values for your own cluster.
References
- Grafana Alloy
- Alloy River config language
- Alloy Helm chart
- Alloy collect-logs-in-kubernetes guide
- loki.source.journal component reference
- loki.source.kubernetes_events component reference
- Argo CD multi-source applications
- Deploy Kubernetes with Kubespray
- Manage Helm apps with Argo CD app-of-apps
- Loki 3 upgrade
- Grafana Alloy migration on Kubernetes
- Monitor Debian Linux with Grafana Alloy