Grafana Loki v3 in a container
If you are not familiar with Grafana Loki, it is an open-source system for aggregating application, system, and other log files for querying and potentially configuring alert notifications when something goes wrong. Check out a previous post where I set up Loki in my homelab.
There are multiple ways to install Grafana Loki. I have in the past run it on a Debian based Linux VM. While building a new server for my logs and metrics, I spun up Loki as a Docker container on my Mac Mini. It is very straightforward to set up a single container for Grafana Loki using Docker Compose, the container includes a default config file for running local. If you are not familiar with Docker or containers, check out a previous post to get started.
I have prepared example instructions for how I have set this up with Docker but software changes over time so if you view this years in the future, check the official documentation for how to install Grafana Loki in a container or other method.
Install with Docker compose
The Maintainers include a Compose file for a demo of Loki along with Grafana.
curl https://raw.githubusercontent.com/grafana/loki/v3.4.1/production/docker-compose.yaml -O docker-compose.yaml # wget also worksI have no idea if that file will stick around. Ultimately I used this as a starting point. You can stop here for a basic functional setup on a Linux system.
Inspect this file:
version: '3.3' # note the version parameter is deprecated but still included in the github link.

networks:
  loki:

services:
  loki:
    image: grafana/loki:latest
    ports:
      - '3100:3100'
    command: -config.file=/etc/loki/local-config.yaml
    networks:
      - loki

  promtail:
    image: grafana/promtail:latest
    volumes:
      - /var/log:/var/log
    command: -config.file=/etc/promtail/config.yml
    networks:
      - loki

  grafana:
    environment:
      - GF_PATHS_PROVISIONING=/etc/grafana/provisioning
      - GF_AUTH_ANONYMOUS_ENABLED=true
      - GF_AUTH_ANONYMOUS_ORG_ROLE=Admin
      - GF_FEATURE_TOGGLES_ENABLE=alertingSimplifiedRouting,alertingQueryAndExpressionsStepMode
    entrypoint:
      - sh
      - -euc
      - |
        mkdir -p /etc/grafana/provisioning/datasources
        cat <<EOF > /etc/grafana/provisioning/datasources/ds.yaml
        apiVersion: 1
        datasources:
        - name: Loki
          type: loki
          access: proxy
          orgId: 1
          url: http://loki:3100
          basicAuth: false
          isDefault: true
          version: 1
          editable: false
        EOF
        /run.sh
    image: grafana/grafana:latest
    ports:
      - '3000:3000'
    networks:
      - loki
To create a container with compose file: docker compose up -d
Without making any modifications, this file should work well on a Linux system that has Docker installed. If you are on a macos system, it will work but you will not be getting the container logs by scraping /var/log that is mounted in the Promtail container. The default promtail configuration will send logs to this url: http://loki:3100/loki/api/v1/push
Since I am running this on a mac mini and I already have Grafana in my homelab, I will be modifying this.
Loki logging driver
Before preparing a new compose file, there is a way to configure docker on the mac mini to send all container logs to Grafana Loki by default. To give this a try there is a docker plugin available to install:
docker plugin install grafana/loki-docker-driver:3.3.2-arm64 --alias loki --grant-all-permissionsSince I am on macos I used the tag suffix -arm64 but if you are on a system that has an x86_64/amd64 CPU architecture, use the suffix -amd64 instead.
Check that the plugin is installed:
docker plugin lsYou should see output like this:
ID             NAME          DESCRIPTION           ENABLED
406fe98a4711   loki:latest   Loki Logging Driver   true
Uninstall/Upgrade the plugin
To upgrade the Loki plugin:
docker plugin disable loki --force
docker plugin upgrade loki grafana/loki-docker-driver:3.3.2-arm64 --grant-all-permissions
docker plugin enable loki
systemctl restart docker
To uninstall the plugin altogether:
docker plugin disable loki --force
docker plugin rm loki
Configure Loki as the default logging driver
You can configure Docker daemons’s engine to use the Loki logging driver as the default for all new containers. This saves you from having to specify log config with every docker run command or in every docker-compose.yml file.
I’m going to stick a caveat here that I could not get this working on a mac mini. I think it will work fine on Linux but when using mac and/or Docker desktop specifically, this does not seem to work.
Configure the Docker Daemon
The process involves editing the Docker daemon’s configuration file, daemon.json. Docker Desktop provides a GUI for this in the Settings.
-
Open Docker Desktop Settings:
- Click the Docker icon in your Mac’s menu bar. (Or the taskbar in Windows)
- Select Settings (or Preferences on older versions).
-
Navigate to the Docker Engine Tab:
- In the left-hand menu, click on Docker Engine.
- You will see a JSON editor where you can modify the
daemon.jsonconfiguration.
-
Edit the Configuration: Add the
log-driverandlog-optskeys to the JSON object. You must provide the URL for your Loki server.{ "builder": { "gc": { "defaultKeepStorage": "20GB", "enabled": true } }, "experimental": false, "features": { "buildkit": true }, "log-driver": "loki", "log-opts": { "loki-url": "http://<your-loki-host>:3100/loki/api/v1/push" } }- Important: Be careful to maintain valid JSON syntax. If the file already has content, just add the new keys, ensuring there are commas after the preceding lines.
- Replace
<your-loki-host>with the actual hostname or IP address of your Grafana Loki server.
-
Apply and Restart:
- Click the Apply & Restart button. Docker will save your changes and restart the Docker engine.
From now on, any new container you start (without a different logging driver specified in its run command) will automatically send its logs directly to your Loki instance. If you have existing containers you will need to recreate them. For example using compose: docker compose down && docker compose up -d
Configure a container to use the Loki driver upon creation
The docker run command can be configured to use a different logging driver than the Docker daemon’s default with the --log-driver flag.
You can add these options to a docker run command:
docker run --log-driver=loki \
    --log-opt loki-url="http://loki.example.com/loki/api/v1/push" \ # Replace with your server
    --log-opt loki-retries=5 \
    --log-opt loki-batch-size=400 \
    grafana/grafana
If you have a docker compose file, you can add the log options there:
services:
  logger:
    image: grafana/grafana
    logging:
      driver: loki
      options:
        loki-url: 'http://loki.example.com/loki/api/v1/push'
To create a container with compose file: docker compose up -d
My Loki compose file
Since I already have Grafana itself running in my homelab and I am using Grafana Alloy since Promtail is being sunset, I am using a different compose file to align Loki with my existing containers.
services:
  loki:
    image: grafana/loki:latest
    ports:
      - '3100:3100'
    command: -config.file=/etc/loki/local-config.yaml
This will run Loki by itself and your host system can receive requests for Loki on port 3100.
Collect Docker logs (and metrics) with Grafana Alloy
I have set up Grafana Alloy in the past in response to the Promtail project being put in maintenance only mode until 2026. Fortunately, with proper binds, Alloy can collect the logs and send them along to Loki. Check out a previous post to see more info about how to use Grafana Alloy.
In this example scenario, Alloy collects Docker container metrics and logs and forwards them to a Loki instance on the host system but you can use any other URL if Loki is running on another server. This example uses a config.alloy file to configure Alloy components for metrics and logging. You will need to have Prometheus and Loki running for this to work.
*If you do not want to collect container metrics with Alloy, omit those components from the config.
The metrics configuration in this example requires three components:
prometheus.exporter.cadvisorprometheus.scrapeprometheus.remote_write
The logging configuration in this example requires four components:
discovery.dockerdiscovery.relabelloki.source.dockerloki.write
Here is the example config file I am using when Loki is already running in another container on the host where alloy is running:
config.alloy
// Metrics Config
prometheus.exporter.cadvisor "docker" {
  docker_only = true
}

discovery.relabel "cadvisor_metrics" {
  targets = prometheus.exporter.cadvisor.docker.targets

  rule {
  	target_label = "job"
  	replacement = "integrations/docker"
  }
  rule {
  	target_label = "instance"
  	replacement = constants.hostname
  }
}

prometheus.scrape "cadvisor" {
  targets         = discovery.relabel.cadvisor_metrics.output
  scrape_interval = "15s"
  forward_to      = [prometheus.remote_write.to_prom.receiver]
}

prometheus.remote_write "to_prom" {
  endpoint {
    url = "http://host.docker.internal:9090/api/v1/write"
  }
}

// Logs config
discovery.docker "local" {
  host = "unix:///var/run/docker.sock"
}

discovery.relabel "logs_service_name" {
  targets = []
  rule {
    source_labels = ["__meta_docker_container_name"]
    regex        = "/(.*)"
    target_label = "container_name"
  }
  rule {
  	source_labels = ["__meta_docker_container_log_stream"]
  	target_label = "stream"
  }
  rule {
  	source_labels = ["__meta_docker_container_id"]
  	target_label = "container_id"
  }
  rule {
  	source_labels = ["__meta_docker_container_image"]
  	target_label = "image_name"
  }
  rule {
  	target_label = "instance"
  	replacement = constants.hostname
  }
  rule {
  	target_label = "job"
  	replacement = "integrations/docker"
  }
}

loki.source.docker "docker" {
  host    = "unix:///var/run/docker.sock"
  targets = discovery.docker.local.targets

  relabel_rules = discovery.relabel.logs_service_name.rules

  forward_to = [loki.write.default.receiver]
}

loki.write "default" {
  endpoint {
    url = "http://host.docker.internal:3100/loki/api/v1/push"
  }
}
This comes with a caveat, the log forwarding is working how I expect but I cannot get the cadvisor metrics to work properly. Someone let me know if you figure this out.
docker-compose.yml
To run alloy as a container, create a docker-compose.yml file in the same directory as the config.alloy file:
services:
  alloy:
    image: docker.io/grafana/alloy:latest
    privileged: true
    container_name: alloy
    restart: unless-stopped
    command:
      [
        'run',
        '--server.http.listen-addr=0.0.0.0:12345',
        '/etc/alloy/config.alloy',
        '--storage.path=/var/lib/alloy/data',
      ]
    ports:
      - '12345:12345'
      - '4317:4317'
      - '4318:4318'
    environment:
      ALLOY_DEPLOY_MODE: docker
    volumes:
      - ./config.alloy:/etc/alloy/config.alloy
      - /proc:/rootproc:ro
      - /var/run/docker.sock.raw:/var/run/docker.sock
      - /sys:/sys:ro
      - /:/rootfs:ro
      - /dev/disk/:/dev/disk:ro
      - /var/lib/docker/:/var/lib/docker:ro
    extra_hosts:
      - 'host.docker.internal:host-gateway'
    devices:
      - /dev/kmsg
To create a container with compose file: docker compose up -d
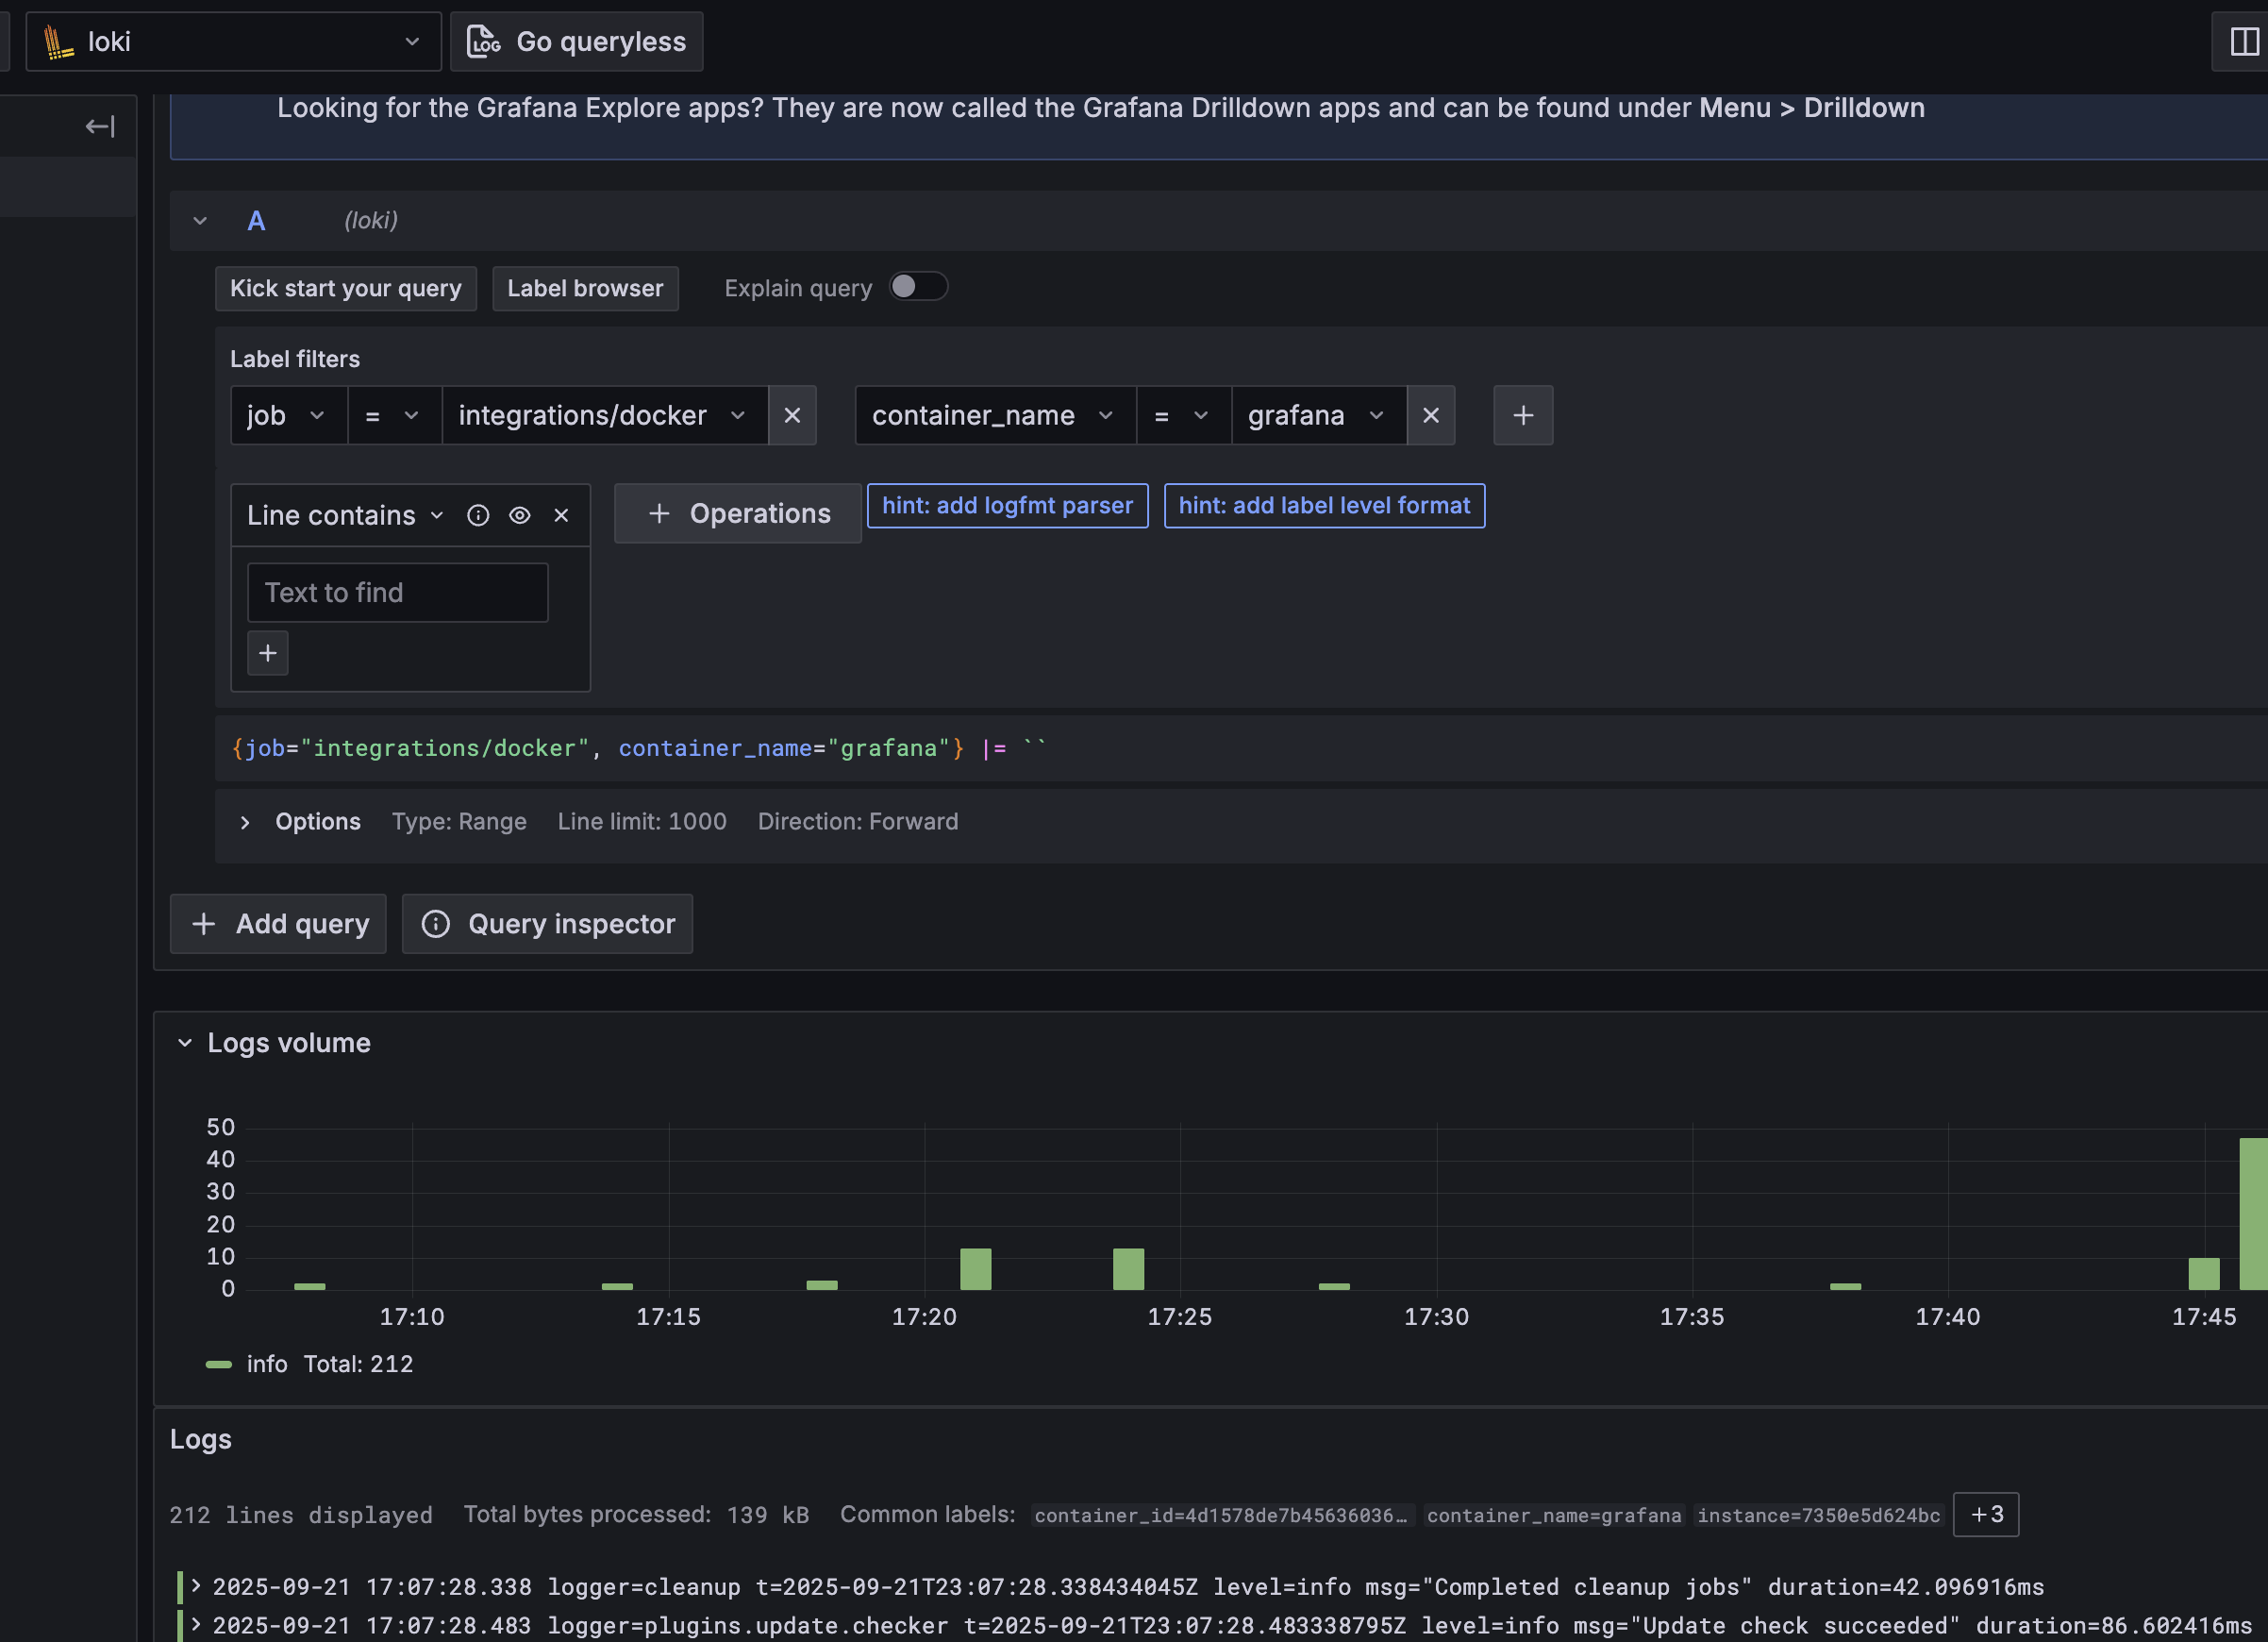
Once the alloy container is running, logs and optionally metrics are being sent from alloy to the specified urls. Alloy has a web UI that can be accessed in the browser on port 12345. Assuming that you have Grafana running and connected to Loki, you should now be able to query logs and metrics that match the container_name, job, and instance labels that we specify in the Alloy config.
Closing thoughts
This project did not turn out how I imagined. I found a few ways to get Logs (and metrics) for Docker containers reliably but only for Linux systems. The Mac + Docker setup continues to frustrate me with an otherwise very stable Mac mini. I think I may switch to a Linux VM on the Mac but I have had a lot of issues with Colima which is a lightweight VM so I do not think there is an ideal solution. The Mac is a great desktop but a horrible server for me.