Netdata
In today’s tech infrastructure landscape, understanding what’s happening on your systems in real-time can be the difference between catching a problem before it escalates and dealing with an outage. Netdata is an open-source, distributed monitoring solution that brings real-time, per-second metrics to your infrastructure. This blog post explores what Netdata is and how it differs from traditional monitoring approaches. While it may seem like overkill for a simple homelab, Netdata is actually remarkably easy to deploy and scales effortlessly from a single system to hundreds of nodes.
What Makes Netdata interesting
Netdata provides per-second metric collection with real-time visualization, setting it apart from many monitoring tools (like Prometheus or Telegraf) that typically collect data every 15-60 seconds. This granularity allows you to see the exact moment when issues occur and understand the micro-behavior of your systems and applications.
Unlike centralized monitoring solutions that funnel all data into central databases, Netdata processes data at the edge, keeping metrics close to their source. This distributed design minimizes network overhead and ensures that even if your central infrastructure fails, local monitoring continues uninterrupted.
Core Features of Netdata:
-
Real-Time Per-Second Metrics: Netdata collects and visualizes metrics every second, giving you immediate visibility into system behavior Netdata docs.
-
Zero-Configuration Deployment: Install Netdata with one simple command and get fully automated dashboards with hundreds of preconfigured alerts, eliminating hours of manual setup. You don’t need to set up a tool like Grafana to view netdata metrics.
-
Comprehensive Integrations: Netdata includes hundreds of integrations covering OS metrics, container metrics, VMs, hardware sensors, application metrics, and more Netdata metric features.
-
Built-in Machine Learning: Netdata provides anomaly detection machine learning models that run on the edge, the cloud platform is not required. Netdata ML features
-
Distributed Architecture: Parent-child relationships allow flexible centralization with multi-level replication and retention, enabling you to scale from one node to thousands.
-
Low Resource Footprint: Designed to run permanently on all systems without disrupting core functions, using minimal CPU and memory resources.
Understanding Netdata Metrics
Netdata automatically collects thousands of metrics across different categories:
System Metrics: CPU usage, memory utilization, disk I/O, network traffic, and system load.
Container Metrics: Docker and Kubernetes container statistics including resource usage and performance.
Application Metrics: Built-in collectors for popular applications like Nginx, Apache, MySQL, PostgreSQL, Redis, and many more.
Hardware Metrics: Temperature sensors, fan speeds, power consumption, and IPMI data from physical hardware.
Getting Started with Netdata Using Docker
One of the easiest ways to run Netdata is using Docker. Docker deployment is particularly useful for homelabs and development environments where you want isolated, reproducible deployments. If you are not familiar with Docker and containers, check out a previous post for a more general introduction.
Prerequisites
Before you begin, ensure you have:
- Docker installed and running on your system.
- Basic familiarity with Docker commands
- Sufficient permissions to run Docker containers with elevated capabilities
Docker Compose Installation
Create a docker-compose.yml file with the following configuration (works on Linux hosts or Docker Desktop 4.34+ with host networking enabled). Host networking and the rslave mount flag are not supported on standard macOS/Windows Docker Desktop builds. See Docker documentation.
services:
  netdata:
    image: netdata/netdata
    container_name: netdata
    pid: host
    network_mode: host
    restart: unless-stopped
    cap_add:
      - SYS_PTRACE
      - SYS_ADMIN
    security_opt:
      - apparmor:unconfined
    volumes:
      - netdataconfig:/etc/netdata
      - netdatalib:/var/lib/netdata
      - netdatacache:/var/cache/netdata
      - /:/host/root:ro,rslave
      - /etc/passwd:/host/etc/passwd:ro
      - /etc/group:/host/etc/group:ro
      - /etc/localtime:/etc/localtime:ro
      - /proc:/host/proc:ro
      - /sys:/host/sys:ro
      - /etc/os-release:/host/etc/os-release:ro
      - /var/log:/host/var/log:ro
      - /var/run/docker.sock:/var/run/docker.sock:ro
      - /run/dbus:/run/dbus:ro

volumes:
  netdataconfig:
  netdatalib:
  netdatacache:
This configuration uses several important settings:
pid: host- Allows Netdata to monitor all processes on the hostnetwork_mode: host- Enables monitoring of all network interfacescap_add- Grants necessary capabilities for full system monitoring- Multiple volume mounts provide read-only access to host system directories
If you are on macOS or Windows (or otherwise cannot use host networking or mount propagation), use this bridge-mode variant instead:
services:
  netdata:
    image: netdata/netdata
    container_name: netdata
    restart: unless-stopped
    ports:
      - '19999:19999'
    cap_add:
      - SYS_PTRACE
    security_opt:
      - apparmor:unconfined
    volumes:
      - netdataconfig:/etc/netdata
      - netdatalib:/var/lib/netdata
      - netdatacache:/var/cache/netdata
      - /var/run/docker.sock:/var/run/docker.sock:ro

volumes:
  netdataconfig:
  netdatalib:
  netdatacache:
You lose full host visibility in this mode but still get container metrics through the Docker socket.
The content in this post is likely to be out of date eventually, check the Netdata documentation for up to date instructions for installing with Docker.
Starting Netdata
Once you’ve created the Docker Compose file, start Netdata with:
docker compose up -dAccessing the Dashboard
After the container starts, navigate to http://localhost:19999 in your browser to access the Netdata dashboard.
No additional configuration is required for basic monitoring.
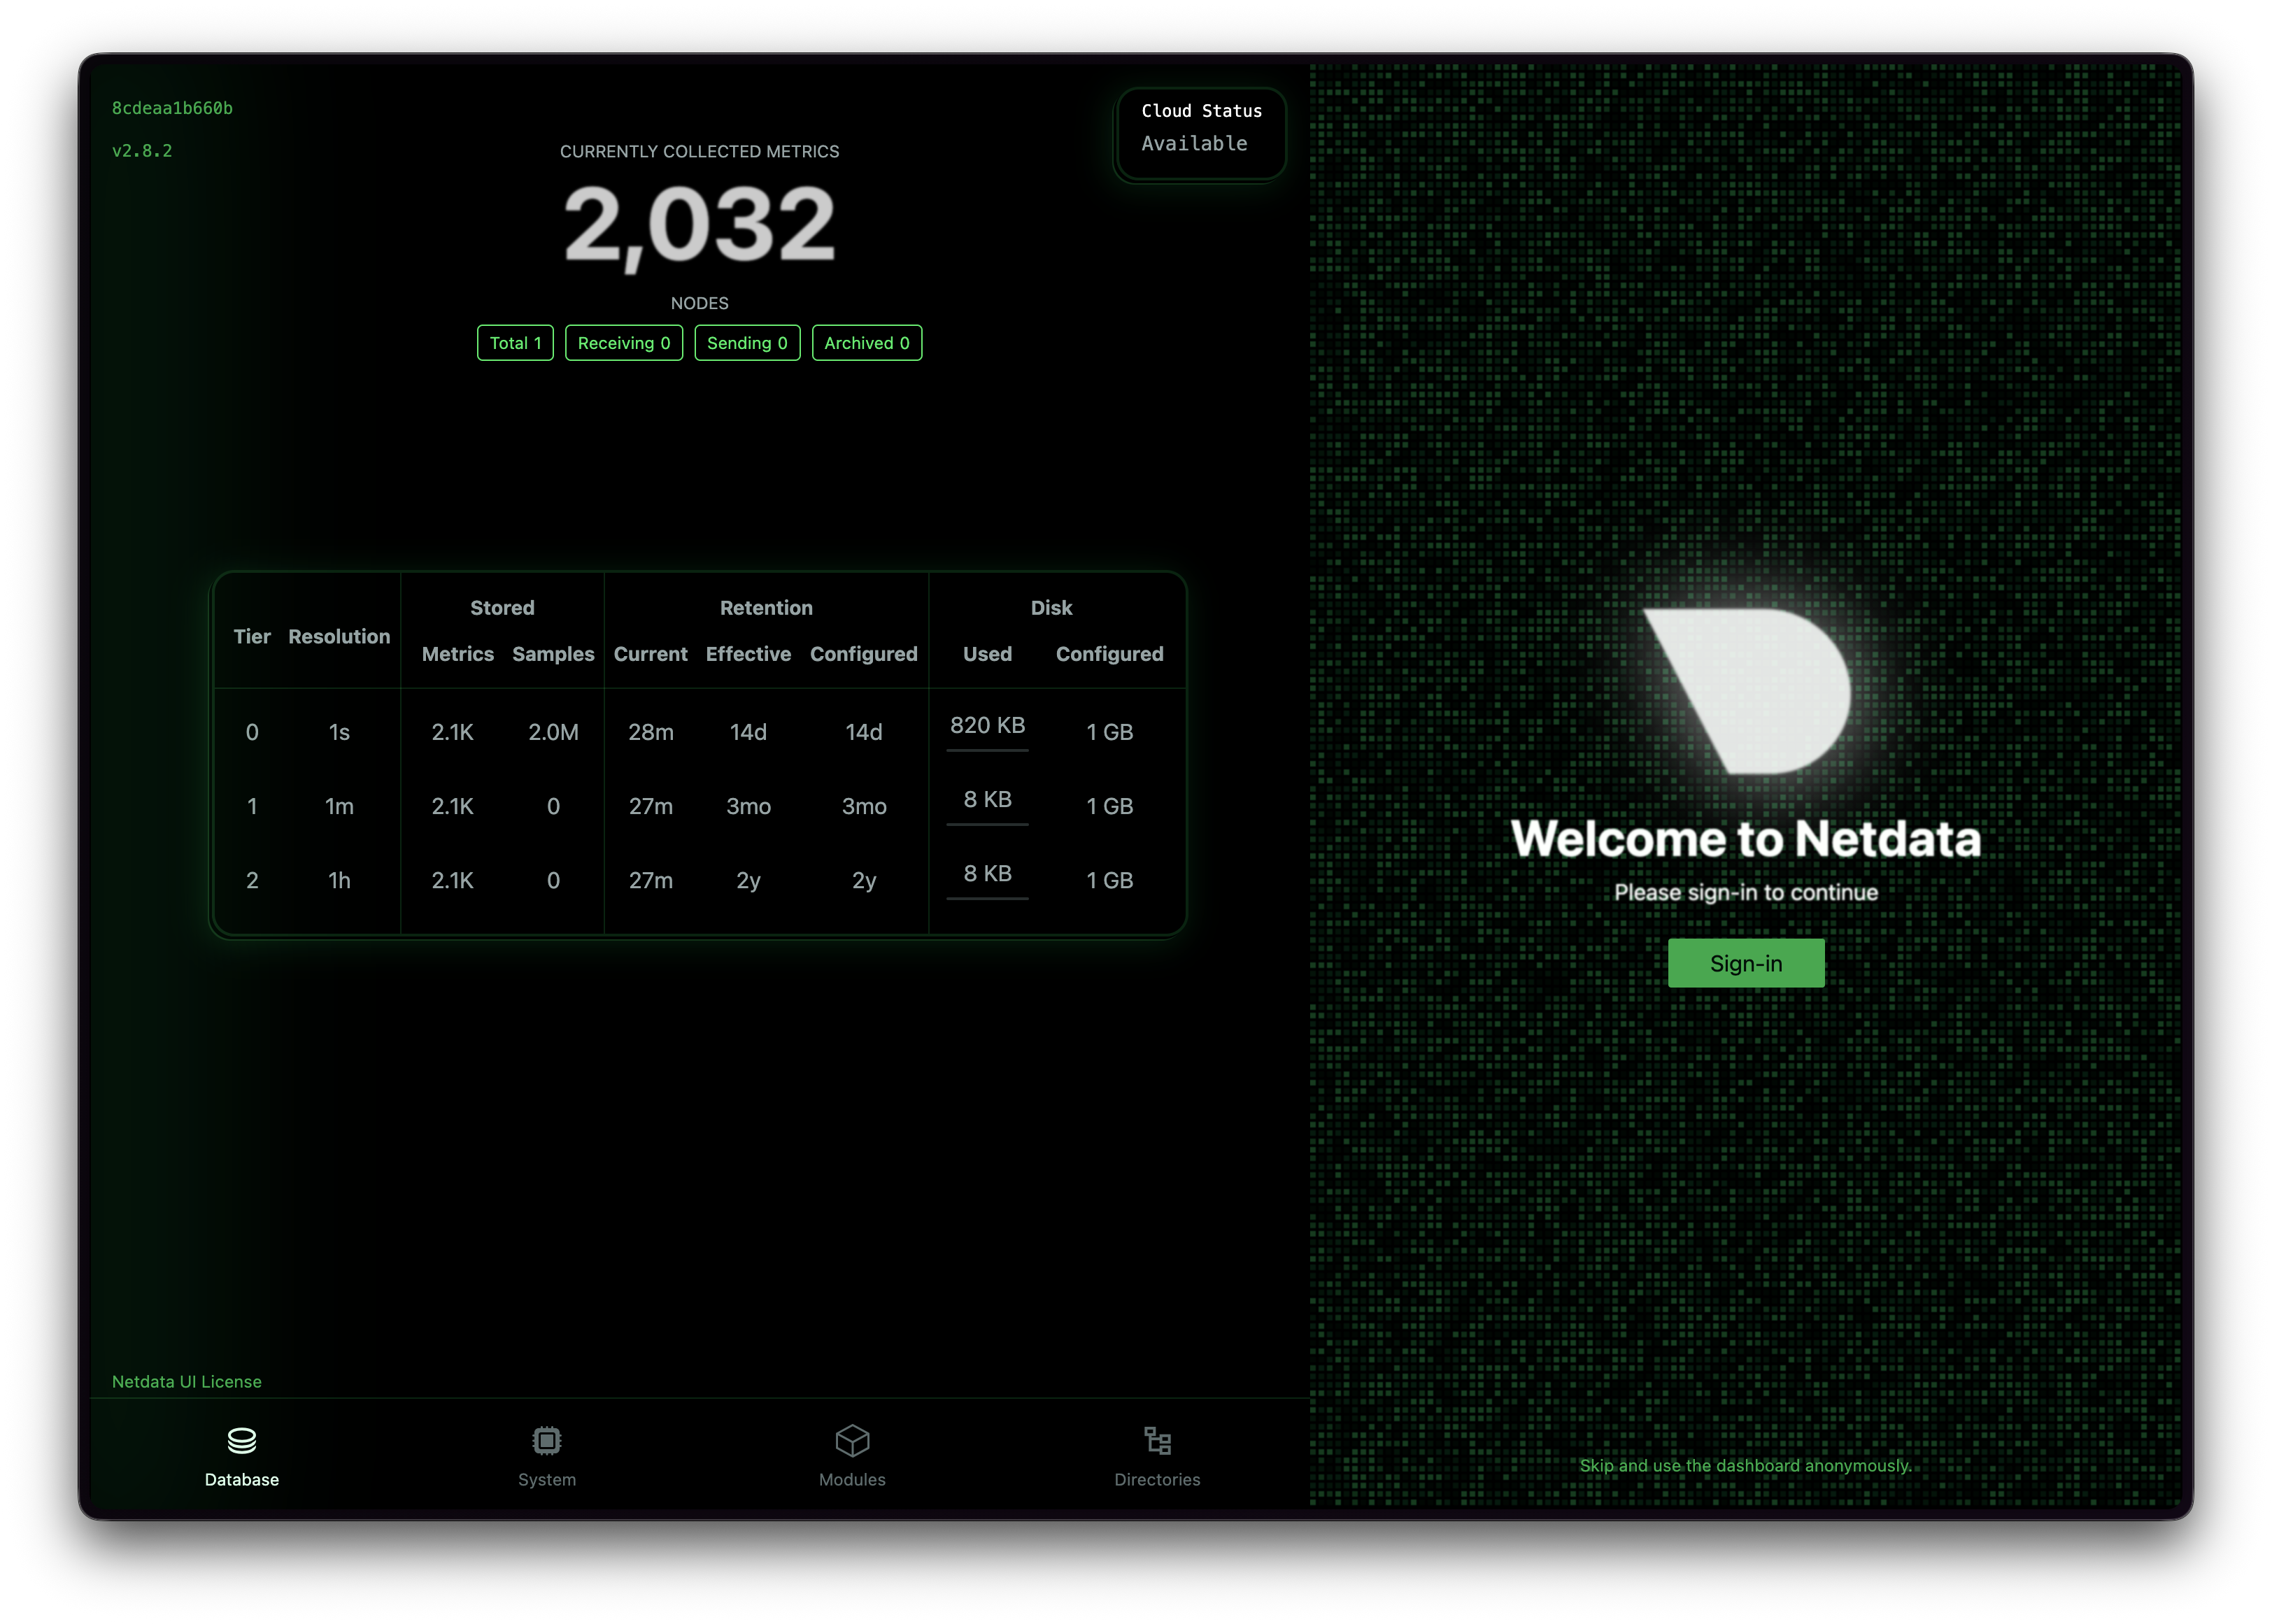
When you first open the dashboard you will see an overview of the Database on the local node. In the corner you can skip login and proceed to the dashboard.
Exploring the Dashboard
The Netdata dashboard organizes metrics into sections:
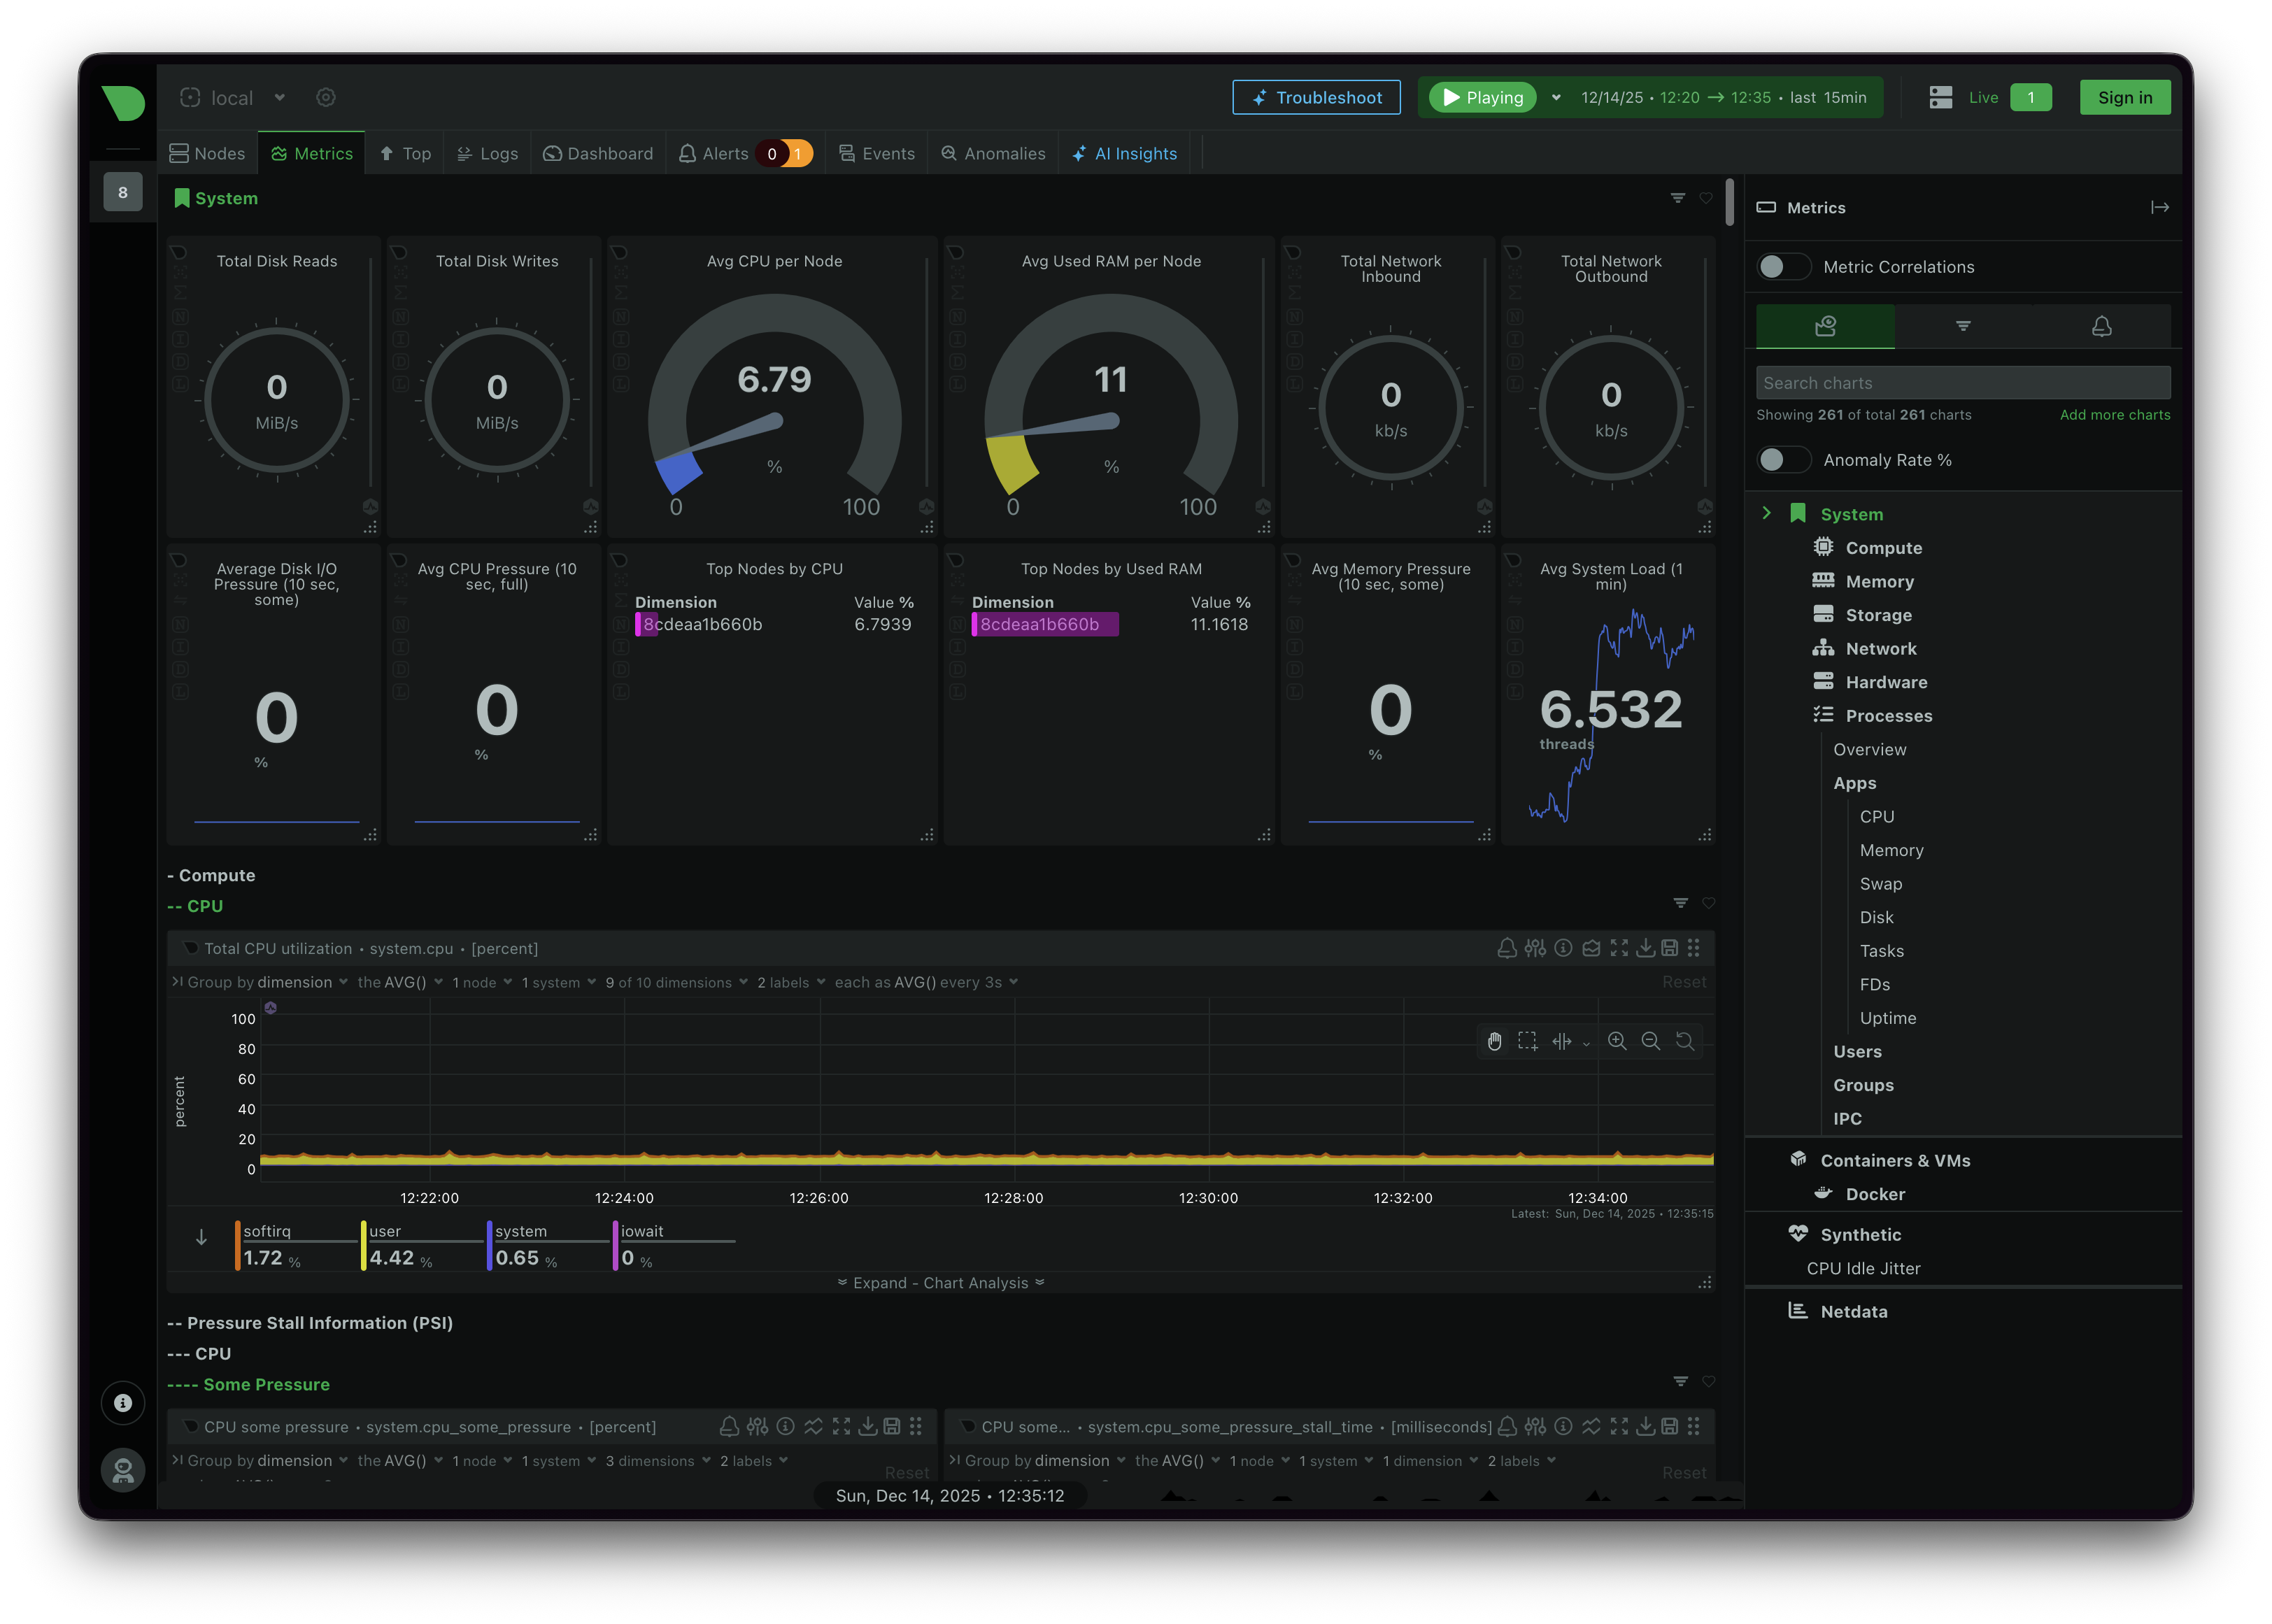
Each chart is interactive - you can zoom, pan, and hover for precise values. The dashboard updates every second.
Integrating Netdata with Prometheus
While Netdata’s built-in dashboard is excellent for real-time monitoring, you may want to integrate it with Prometheus for long-term storage, centralized querying, or use with existing Grafana dashboards. Netdata supports exporting metrics to Prometheus using the Prometheus Remote Write protocol. Exported metrics will not have seconds level precision but include a sample from the time of each export interval.
Why Use Remote Write?
The Remote Write protocol allows Netdata to push metrics directly to Prometheus or any compatible time-series database. This is useful when:
- You want to centralize metrics from multiple Netdata instances
- You need long-term metric retention beyond Netdata’s local storage
- You’re already using Prometheus as your central metrics store
- You want to combine Netdata metrics with other Prometheus data sources
Configuring Prometheus for Remote Write
First, ensure your Prometheus server is configured to receive remote write data. You need to start Prometheus with the remote write receiver feature enabled:
./prometheus --config.file=prometheus.yml --web.enable-remote-write-receiverConfiguring Netdata to Export Metrics
On your Netdata instance, edit the exporting configuration file:
cd /etc/netdata
sudo ./edit-config exporting.conf
Add the following configuration to enable Prometheus remote write:
[exporting:global]
    enabled = yes
    update every = 10

[prometheus_remote_write:prometheus_instance]
    enabled = yes
    destination = localhost:9090
    remote write URL path = /api/v1/write
If your Netdata is running in Docker, you can mount a custom configuration file or edit it within the container:
docker exec -it netdata /bin/sh
cd /etc/netdata
./edit-config exporting.conf
For a single Docker Compose stack that runs both Netdata and Prometheus, set destination = prometheus:9090 so Netdata can reach Prometheus over the default compose network.
Compose example with prometheus
Use this for a docker-compose.yml for testing with Prometheus on a system with Docker desktop:
services:
  netdata:
    image: netdata/netdata:stable
    container_name: netdata
    restart: unless-stopped
    ports:
      - '19999:19999'
    cap_add:
      - SYS_PTRACE
    security_opt:
      - apparmor:unconfined
    volumes:
      - netdataconfig:/etc/netdata
      - ./config/netdata/exporting.conf:/etc/netdata/exporting.conf:ro
      - netdatalib:/var/lib/netdata
      - netdatacache:/var/cache/netdata
      - /var/run/docker.sock:/var/run/docker.sock:ro

  prometheus:
    image: prom/prometheus:latest
    container_name: prometheus
    restart: unless-stopped
    ports:
      - '9090:9090'
    command:
      - '--config.file=/etc/prometheus/prometheus.yml'
      - '--web.enable-remote-write-receiver'
    volumes:
      - ./config/prometheus/prometheus.yml:/etc/prometheus/prometheus.yml:ro
      - prometheusdata:/prometheus

volumes:
  netdataconfig:
  netdatalib:
  netdatacache:
  prometheusdata:
Configuration Options
The exporting configuration supports several options:
update every: How often (in seconds) to send metrics to Prometheus. Default is 10 seconds.
destination: The IP address and port of your Prometheus server.
remote write URL path: The API endpoint path, typically /api/v1/write.
Prerequisites: The exporter depends on protobuf and snappy compression libraries; ensure they are present in your environment or image before enabling remote write. See Netdata docs. The Docker based install should have everything required.
If using the edit-config command or mounting a config file, here is an example of what to configure. Replace the destination parameter if you are not using a prometheus container on the same network as netdata.
exporting.conf
[exporting:global]
    enabled = yes
    update every = 10

[prometheus_remote_write:local_prom]
    enabled = yes
    destination = prometheus:9090
    remote write URL path = /api/v1/write
Verifying the Integration
After editing the configuration, restart Netdata:
# For Docker:
docker restart netdata

# For native installation:
sudo systemctl restart netdata
Once configured, verify that metrics are flowing:
- Check Netdata’s logs for export status:
docker logs netdata | grep prometheus- Query Prometheus to confirm metrics are being received:
- Navigate to
http://localhost:9090 - In the query field, start typing
netdata_to see available metrics - Execute a query like
netdata_system_cpu_percentage_averageto view data
- Navigate to
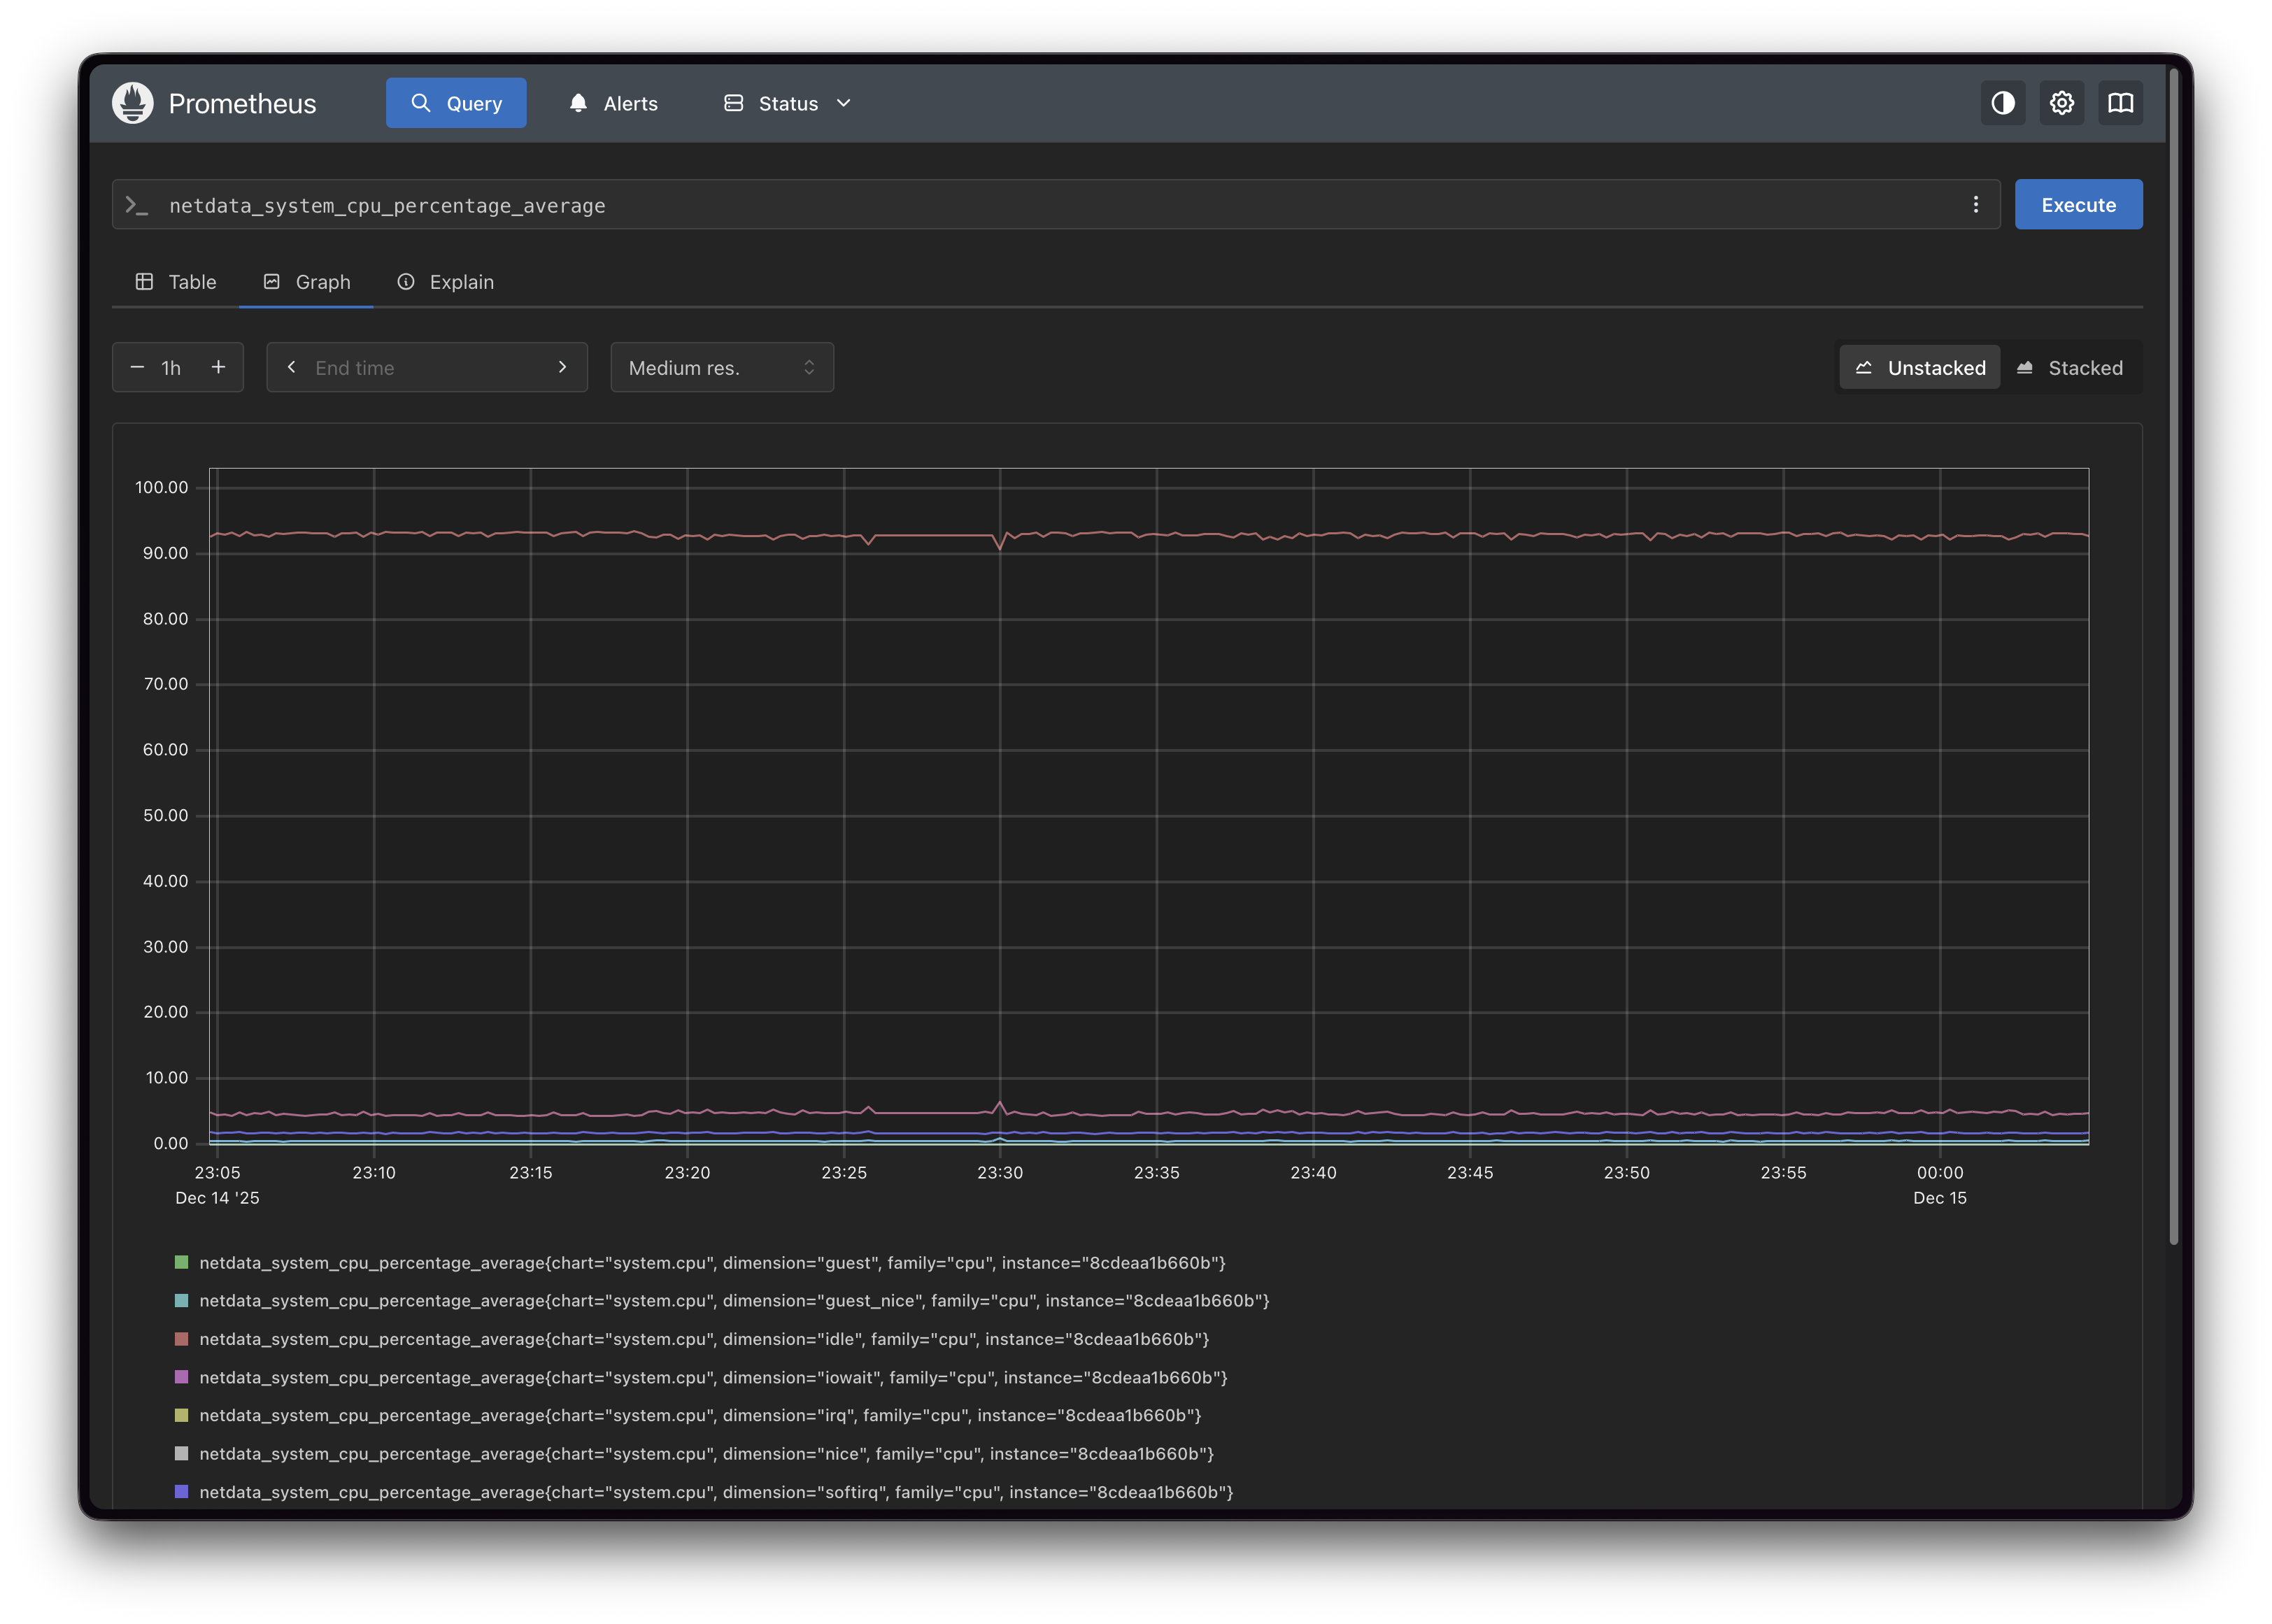
Metric Naming in Prometheus
Netdata exports metrics with descriptive names that include the context and units. For example:
netdata_system_cpu_percentage_average- Average CPU usagenetdata_system_ram_MiB_average- RAM usage in mebibytesnetdata_disk_io_KiB_persec_average- Disk io average labeled in reads and writes
Each metric includes labels for additional dimensions:
netdata_system_cpu_percentage_average{
  chart="system.cpu",
  family="cpu",
  dimension="user"
} 45.2
Next Steps
Now that you have Netdata running and optionally integrated with Prometheus, you can:
- Explore Custom Dashboards: Create custom Netdata dashboards for specific use cases
- Configure Alerts: Set up alert notifications via Slack, email, PagerDuty, or other channels
- Deploy Netdata Parents: Set up parent-child relationships for centralized monitoring of multiple nodes
- Visualize with Grafana: Use the Prometheus integration to create Grafana dashboards combining Netdata metrics with other data sources
- Enable Netdata Cloud: Connect your agents to Netdata Cloud for centralized management and AI-powered troubleshooting
Netdata’s strength lies in its simplicity. Whether you’re monitoring a single homelab server or a fleet of production systems, Netdata provides the visibility you need to keep things running smoothly.
New disclaimer I am adding: I used an LLM to help create this post but afterwards I spent more than an hour editing it to the final form.