Prometheus
Organizations rely heavily on metrics to ensure their applications are running smoothly, efficiently, and securely. One of the leading tools in this space is Prometheus , an open-source system designed for event monitoring and alerting. This blog post will delve into what Prometheus is, how it works with metrics, and why it’s become a staple in modern infrastructure management. It may be overkill for a homelab but it is actually a simple system that scales well. You can start by monitoring no more than a single system and/or application and scale to hundreds or more. Metrics are the core of any monitoring system. They provide quantitative data about various aspects of your systems and applications, such as performance, resource usage, error rates, and more. Prometheus collects these metrics from configured targets at specified intervals.
Core Features of Prometheus:
-
Multi-dimensional Data Model: Prometheus stores metrics as time-series data with labels attached. This allows for flexible queries and aggregation.
-
PromQL (Prometheus Query Language): A powerful querying language that enables users to explore and analyze their metrics effectively.
-
Pull-based Model: Instead of pushing metrics from the targets, Prometheus pulls them at regular intervals, which simplifies configuration and reduces network traffic issues.
-
Service Discovery: Automatically discovers services in dynamic environments like Kubernetes, ensuring seamless integration with cloud-native applications.
-
Alerting Rules: Configurable rules that trigger alerts based on specific conditions, allowing teams to respond quickly to potential issues.
-
Scalability and High Availability: Supports horizontal scaling and can be deployed in a high-availability configuration for critical workloads.
Types of Metrics in Prometheus:
-
Counters: Incremental counters that only increase or reset to zero on restart.
-
Gauges: Represent a single numerical value that can arbitrarily go up and down.
-
Histograms: Sample observations to compute statistics like percentiles, which are useful for understanding distribution.
-
Summaries: Similar to histograms but provide a total count of observations in addition to quantile calculations.
Collecting Metrics
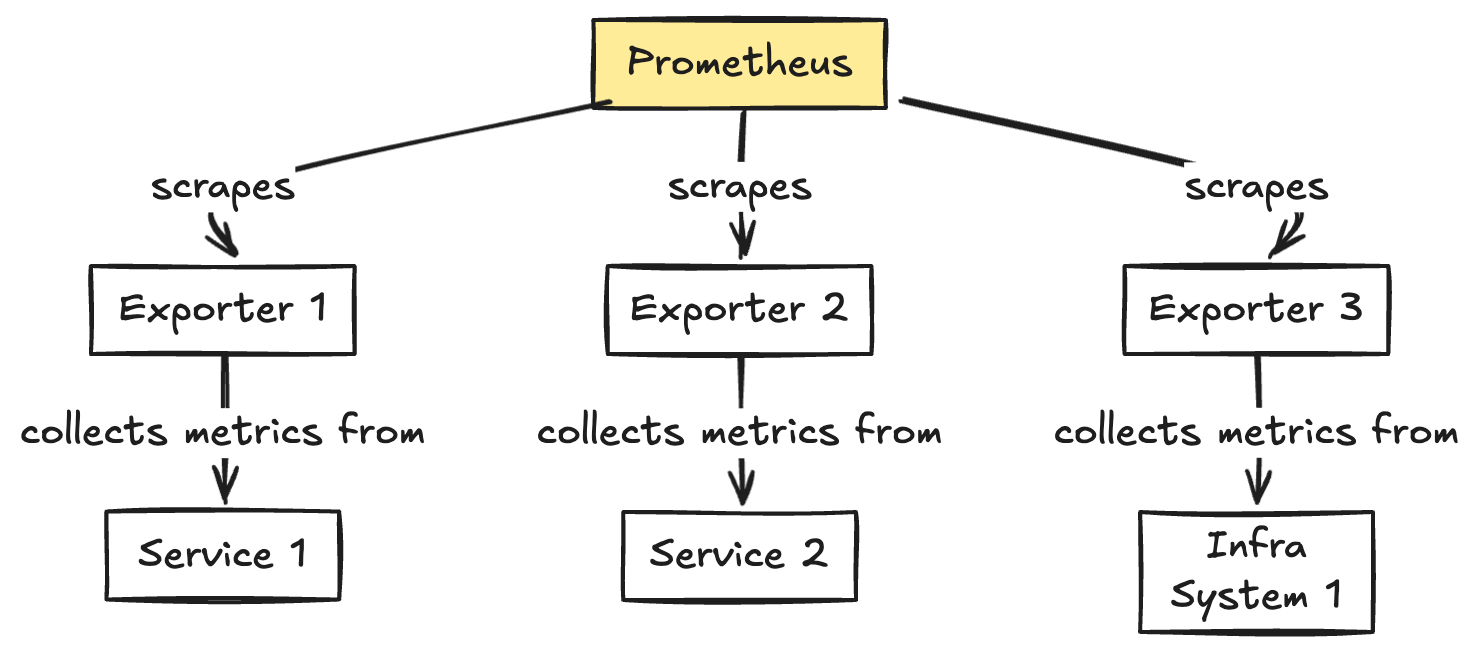
Prometheus collects metrics using an HTTP pull model. Targets expose an /metrics endpoint where Prometheus scrapes data at regular intervals. This method is simple and flexible, allowing easy integration with various services and applications.
Storing Metrics
Once collected, metrics are stored in a local time-series database optimized for fast retrieval of recent data. The storage backend supports efficient querying through PromQL, enabling users to derive meaningful insights from their data.
Getting Started with Prometheus
Setting up Prometheus is straightforward. Here’s a brief overview:
- Installation: Download the latest release from the Prometheus website and extract it. There are executable pre-compiled binaries for many platforms including macOS and Linux and different CPU architectures. If you are on macOS, check out a previous post for a quick method to install and configure prometheus to run as a service when you log in.
- Configuration: Edit the
prometheus.ymlfile to specify your scrape targets and intervals.
Here is an example that will scrape metrics from the local Prometheus server:
global:
  #By default, scrape targets every 15 seconds.
  scrape_interval: 30s
  #Attach these labels to any time series or alerts when communicating w>
  #external systems (federation, remote storage, Alertmanager).
  #external_labels:
  # monitor: 'codelab-monitor'
scrape_configs:
  #The job name is added as a label `job=<job_name>`
  - job_name: 'prometheus'
    # Override the interval that metrics are scraped
    scrape_interval: 15s
    static_configs:
      #targets: value can be a hostname or ip address
- targets: ['localhost:9090']- Running Prometheus: Start the Prometheus server with the command:
./prometheus --config.file=prometheus.yml- Visualization: You can Prometheus’s built-in UI to visualize and query your metrics.
Navigate to http://localhost:9090 in your browser to view the UI.
Next Steps
Now that Prometheus is running, you can start using it with other systems and applications. A popular tool for visualizing metrics is Grafana. Check out a previous post for an example of how I set up Grafana for my homelab in the past.