Parsing workout data from strong app on iOS
I use a mobile iOS app on my iPhone and Apple watch to record my workout sessions at the gym. I thought of this little project to encourage me to practice with some Python and SQL with data that I actually care about.
This mobile app allows you to export data from previous workouts in a CSV file. You could import that file to a spreadsheet but I’m going to import it to a Postgresql database and run a few queries.
After importing the data, I will look at some Python libraries to visualize the data in charts and graphs.
Prerequisites
To follow along with my project you would need to be a user of this application in order to have the same CSV data but if you are just interested in using some sample data to explore the Python data visualization I open sourced some of my earliest workouts in a CSV file on GitHub.
Other than data, you need a computer with Python installed and a text editor but that is it, a CSV file and Python on your system. Instructions for installing Python on your platform (could be Microsoft Windows, macOS, Linux, BSD, etc.) could change over time so check out the official website for Python.
pip requirements
You will need some Python packages installed with pip.
pip install pandasThis package allows interacting with the data in the CSV file.
Convert the CSV file to a sqlite3 database
pip install pandasRequirement already satisfied: pandas in ./.venv/lib/python3.9/site-packages (2.2.2)
Requirement already satisfied: numpy>=1.22.4 in ./.venv/lib/python3.9/site-packages (from pandas) (2.0.2)
Requirement already satisfied: python-dateutil>=2.8.2 in ./.venv/lib/python3.9/site-packages (from pandas) (2.9.0.post0)
Requirement already satisfied: pytz>=2020.1 in ./.venv/lib/python3.9/site-packages (from pandas) (2024.1)
Requirement already satisfied: tzdata>=2022.7 in ./.venv/lib/python3.9/site-packages (from pandas) (2024.1)
Requirement already satisfied: six>=1.5 in ./.venv/lib/python3.9/site-packages (from python-dateutil>=2.8.2->pandas) (1.16.0)
[1m[[0m[34;49mnotice[0m[1;39;49m][0m[39;49m A new release of pip is available: [0m[31;49m23.2.1[0m[39;49m -> [0m[32;49m24.3.1[0m
[1m[[0m[34;49mnotice[0m[1;39;49m][0m[39;49m To update, run: [0m[32;49mpip install --upgrade pip[0m
Note: you may need to restart the kernel to use updated packages.
After installing pandas, convert the exported CSV. Create a new .py file. For example, workouts.py.
import sqlite3
import pandas as pd
from sqlite3 import Error
import sys
import argparse

# Function to create a connection to the SQLite database
def create_connection():
    conn = None
    try:
        # Create a new SQLite connection or open an existing one
        conn = sqlite3.connect('strong.db')
        print(sqlite3.version)
    except Error as e:
        print(e)
    finally:
        if conn:
            return conn

# Function to convert CSV to SQLite
def csv_to_sqlite(csv_file, table_name):
    # Create connection to the database
    conn = create_connection()
    print("Create connection to the database...")

    # Read CSV file into pandas DataFrame
    df = pd.read_csv(csv_file)
    print("Read CSV file into pandas DataFrame...")
    # Write DataFrame to SQLite database
    df.to_sql(table_name, conn, if_exists='replace', index=False)
    print("Write DataFrame to SQLite database...")

    # Close the connection
    conn.close()
    print("Done!")

# Create argument parser
parser = argparse.ArgumentParser()
parser.add_argument("csv_file", help="The CSV file to convert")
args = parser.parse_args()


if __name__ == "__main__":
    # Call function with supplied CSV file and table name as arguments
    csv_to_sqlite(args.csv_file, 'strong')
The main method for this Python program calls the csv_to_sqlite() function. This function needs a CSV file as an input. You supply the path to a CSV file as the first argument when calling the main function in this module. The name of the table created will be ‘strong’ which is another parameter passed to the csv_to_sqlite() function.
You can execute this script with a python interpreter:
python3 workouts.py csv_file.csvCreate connection to the database...
Read CSV file into pandas DataFrame...
Write DataFrame to SQLite database...
Done!There should be a strong.db file in the current directory.
The columns of the database are derived from the first row of the csv file.

Example SQL query to select most common columns by year
Here is an example SQL query that will show me all rows from the year 2024 along with the name of my workout routine, the name of the exercise, the weight, and the reps performed in a set. Each row in the database represents one set of a workout routine.
SELECT date(Date) Date,
"Workout Name",
"Exercise Name",
Weight,
Reps
from strong
WHERE Date LIKE '2024%'
ORDER BY Date DESC;
In the example csv file, the dates are in the year 2020 so you can adjust the query or remove the WHERE statement. Here is an example of the output truncated:
| Date | Workout Name | Exercise Name | Weight | Reps |
|---|---|---|---|---|
| 2024-11-02 | Friday-lower-squats | Squat (Barbell) | 45.0 | 12 |
| 2024-11-02 | Friday-lower-squats | Squat (Barbell) | 135.0 | 12 |
| 2024-11-02 | Friday-lower-squats | Squat (Barbell) | 155.0 | 10 |
| 2024-11-02 | Friday-lower-squats | Squat (Barbell) | 175.0 | 8 |
| 2024-11-02 | Friday-lower-squats | Lunge (Dumbbell) | 50.0 | 8 |
| 2024-11-02 | Friday-lower-squats | Lunge (Dumbbell) | 50.0 | 8 |
| 2024-11-02 | Friday-lower-squats | Lunge (Dumbbell) | 50.0 | 8 |
| 2024-11-02 | Friday-lower-squats | Hip Adductor (Machine) | 80.0 | 12 |
| 2024-11-02 | Friday-lower-squats | Hip Adductor (Machine) | 90.0 | 12 |
| 2024-11-02 | Friday-lower-squats | Hip Adductor (Machine) | 90.0 | 12 |
| 2024-11-02 | Friday-lower-squats | Hip Thrust (Bodyweight) | 0.0 | 20 |
| 2024-11-02 | Friday-lower-squats | Hip Thrust (Bodyweight) | 0.0 | 20 |
| 2024-11-02 | Friday-lower-squats | Hip Thrust (Bodyweight) | 0.0 | 20 |
| 2024-11-02 | Friday-lower-squats | Bicycle Crunch | 0.0 | 25 |
| 2024-11-02 | Friday-lower-squats | Bicycle Crunch | 0.0 | 25 |
| 2024-11-02 | Friday-lower-squats | Bicycle Crunch | 0.0 | 25 |
| 2024-11-02 | Friday-lower-squats | Flat Knee Raise | 0.0 | 15 |
| 2024-11-02 | Friday-lower-squats | Flat Knee Raise | 0.0 | 15 |
| 2024-11-02 | Friday-lower-squats | Flat Knee Raise | 0.0 | 15 |
| 2024-11-02 | Friday-lower-squats | Side Plank | 0.0 | 0 |
| 2024-11-02 | Friday-lower-squats | Side Plank | 0.0 | 0 |
| 2024-11-02 | Friday-lower-squats | Side Plank | 0.0 | 0 |
| 2024-11-02 | Friday-lower-squats | Superman | 0.0 | 20 |
| 2024-11-02 | Friday-lower-squats | Superman | 0.0 | 20 |
| 2024-11-02 | Friday-lower-squats | Superman | 0.0 | 20 |
| 2024-11-01 | Thursday- Upper Reps | Incline Bench Press (Barbell) | 45.0 | 12 |
| 2024-11-01 | Thursday- Upper Reps | Incline Bench Press (Barbell) | 115.0 | 12 |
| 2024-11-01 | Thursday- Upper Reps | Incline Bench Press (Barbell) | 115.0 | 12 |
| 2024-11-01 | Thursday- Upper Reps | Incline Bench Press (Barbell) | 115.0 | 12 |
| 2024-11-01 | Thursday- Upper Reps | Incline Bench Press (Barbell) | 115.0 | 12 |
| 2024-11-01 | Thursday- Upper Reps | Chin Up | 0.0 | 8 |
| 2024-11-01 | Thursday- Upper Reps | Chin Up | 0.0 | 8 |
| 2024-11-01 | Thursday- Upper Reps | Chin Up | 0.0 | 8 |
| 2024-11-01 | Thursday- Upper Reps | Chin Up | 0.0 | 8 |
| 2024-11-01 | Thursday- Upper Reps | Face Pull (Cable) | 120.0 | 12 |
| 2024-11-01 | Thursday- Upper Reps | Face Pull (Cable) | 120.0 | 12 |
| 2024-11-01 | Thursday- Upper Reps | Face Pull (Cable) | 120.0 | 12 |
| 2024-11-01 | Thursday- Upper Reps | Face Pull (Cable) | 120.0 | 12 |
| 2024-11-01 | Thursday- Upper Reps | Lateral Raise (Dumbbell) | 20.0 | 12 |
| 2024-11-01 | Thursday- Upper Reps | Lateral Raise (Dumbbell) | 20.0 | 12 |
| 2024-11-01 | Thursday- Upper Reps | Lateral Raise (Dumbbell) | 20.0 | 12 |
| 2024-11-01 | Thursday- Upper Reps | Lateral Raise (Dumbbell) | 20.0 | 12 |
| 2024-11-01 | Thursday- Upper Reps | Shrug (Barbell) | 185.00000000000003 | 10 |
| 2024-11-01 | Thursday- Upper Reps | Shrug (Barbell) | 195.0 | 10 |
| 2024-11-01 | Thursday- Upper Reps | Shrug (Barbell) | 195.0 | 10 |
| 2024-11-01 | Thursday- Upper Reps | Triceps Pushdown (Cable - Straight Bar) | 80.0 | 16 |
| 2024-11-01 | Thursday- Upper Reps | Triceps Pushdown (Cable - Straight Bar) | 70.0 | 16 |
| 2024-11-01 | Thursday- Upper Reps | Triceps Pushdown (Cable - Straight Bar) | 70.0 | 18 |
| 2024-11-01 | Thursday- Upper Reps | Seated Palms Up Wrist Curl (Dumbbell) | 52.5 | 12 |
| 2024-11-01 | Thursday- Upper Reps | Seated Palms Up Wrist Curl (Dumbbell) | 52.5 | 12 |
| 2024-11-01 | Thursday- Upper Reps | Seated Palms Up Wrist Curl (Dumbbell) | 52.5 | 12 |
| 2024-11-01 | Thursday- Upper Reps | Hammer Curl (Dumbbell) | 35.0 | 12 |
Visualize the data
Now that the data is in a database, there are some popular Python libraries available to interact with structure data in a database. The pandas library will help us load data into memory and there are popular libraries such as seaborn and matplotlib for visualizing the data.
Example of visualization
Here is a script that will take some data from the columns in the database and create some diagrams.
Create a .py file and in this example the sqlite database file will be in the same directory as the python script.
import sqlite3
import pandas as pd
import matplotlib.pyplot as plt
import seaborn as sns
# Connect to the SQLite database
db_path = "strong.db"
conn = sqlite3.connect(db_path)
# Query data from a table
query = """SELECT date(Date) Date,
"Workout Name",
"Exercise Name",
Weight,
Reps
from strong
WHERE Date LIKE '2024%'
ORDER BY Date DESC;"""
df = pd.read_sql_query(query, conn)
# Close the connection
conn.close()
# Display the DataFrame from the query
print(df.dtypes) # print data types
print(df.head()) # print the first few results of the query
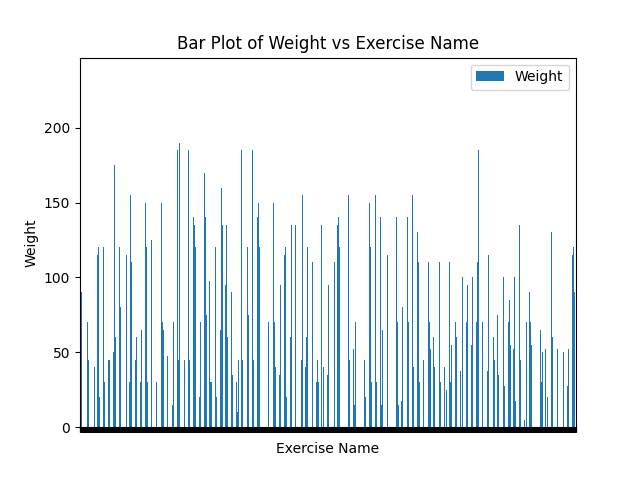
# Example 1: Simple Bar Plot matplotlib
df.plot(kind='bar', x='Exercise Name', y='Weight', title='Bar Plot of Weight vs Exercise Name')
plt.xlabel('Exercise')
plt.ylabel('Weight')
plt.gca().set_xticklabels([])
plt.show()
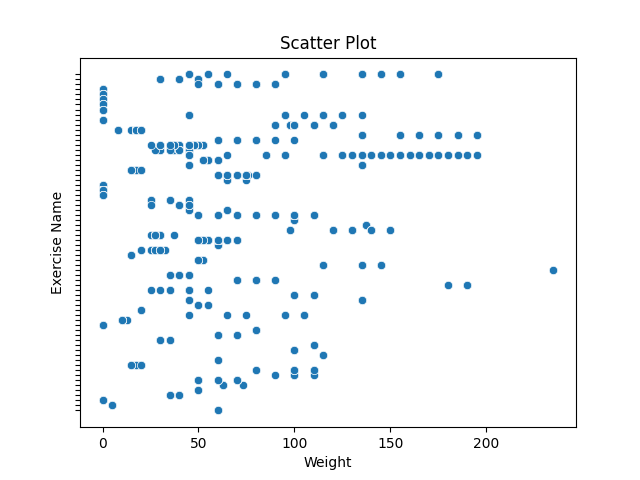
# Example 2: Seaborn Scatter Plot
sns.scatterplot(data=df, x='Weight', y='Exercise Name')
plt.title('Scatter Plot')
plt.xlabel('Weight')
plt.ylabel('Exercise')
plt.gca().set_yticklabels([])
plt.show()
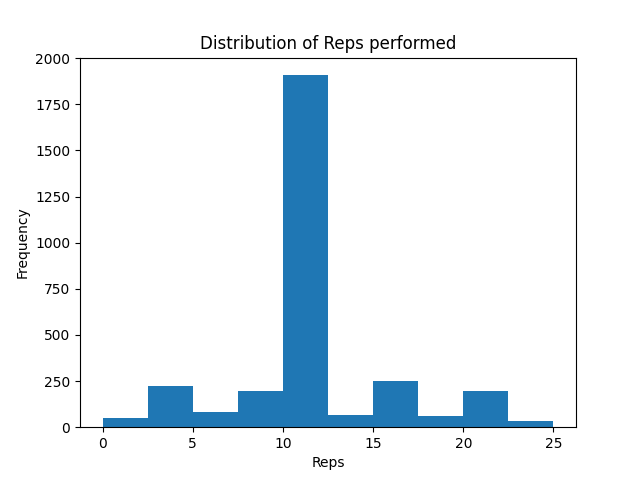
# Example 3: Histogram matplotlib
df['Reps'].plot(kind='hist', title='Distribution of Reps performed', bins=10)
plt.xlabel('Reps')
plt.show()With any luck, when you execute this script you should see three charts similar to below. The column names have spaces so watch out for that.
Bar chart example
Scatter Plot example
Histogram example
Next steps
The next steps for me probably include figuring out what kind of charts I want to create. Most likely I would like to compare the weight and reps performed for each exercise over time. Python can also be used to do some math such as calculating the 1-rep max for an exercise based on the max weight and reps performed. It can also calculate volume of each workout (how much total weight you lifted during the workout).