VictoriaMetrics - Single node setup
Prometheus installations may eventually run into scale limits such as short retention windows or high state cardinality costs. VictoriaMetrics provides a compact time-series database that accepts Prometheus remote write traffic and exposes the same query APIs. This post walks through deploying the single-node container (via docker run or Docker Compose), wiring it into an existing Prometheus and Grafana stack, and highlighting the trade-offs you should validate before production use.
I will be deploying this in my homelab with Docker Compose. There are other installation methods and always consult the official documentation for the latest guidance on installing VictoriaMetrics. If you are not familiar with Docker or containers, check out a previous post to get started.
Why Pick VictoriaMetrics Single-Node?
The single-node edition is aimed at folks that need longer retention without re-architecting their stack around a distributed TSDB. Some features to consider:
- Operational footprint: a single static binary with no external dependencies. downtime and maintenance procedures stay simple compared with complex metric stacks such as Thanos or Mimir.
- Protocol compatibility: accepts Prometheus remote write requests and exposes PromQL/MetricsQL so Grafana dashboards keep working without query rewrites.
- Resource profile: vendor benchmarks report lower RAM and storage overhead than TimescaleDB or InfluxDB for high-cardinality data sets. Take that with a grain of salt and validate against your workload before migrating.
- When to look elsewhere: if you need multi-tenant isolation, horizontal scaling, or complex dedup/federation, evaluate alternatives like Thanos, Cortex, or Mimir instead of or alongside VictoriaMetrics.
Prerequisites
Before you begin, ensure you have:
- An existing Prometheus setup or just familiarity with setting one up quickly.
- Docker or a container runtime for running VictoriaMetrics
- Basic familiarity with Prometheus configuration
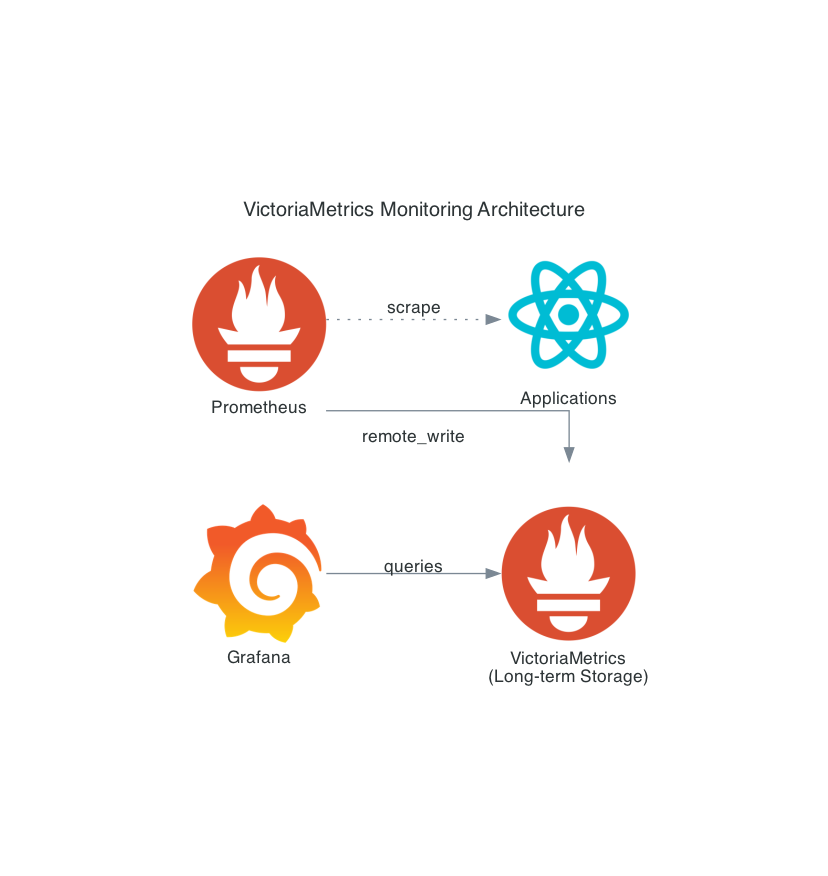
Architecture Overview
Our single-node setup uses the following architecture:
Step 1: Installing VictoriaMetrics Single-Node
VictoriaMetrics single-node is distributed as a single executable without external dependencies, making installation straightforward. We’ll look at two container based options: docker run command for quick trials and a Docker Compose stack.
Docker Installation
# Pull the latest VictoriaMetrics release (see https://github.com/VictoriaMetrics/VictoriaMetrics/releases)
docker pull victoriametrics/victoria-metrics:v1.126.0

# Create a directory for VictoriaMetrics data and run the container
mkdir -p /opt/victoriametrics/data
docker run -d \
  --name victoriametrics \
  -p 8428:8428 \
  -v /opt/victoriametrics/data:/victoria-metrics-data \
  --restart unless-stopped \
  victoriametrics/victoria-metrics:v1.126.0 \
  --selfScrapeInterval=5s \
  --storageDataPath=/victoria-metrics-data \
  --retentionPeriod=90d
Trade-off: enabling
-selfScrapeIntervalmakes VictoriaMetrics ingest its own metrics for observability. Disable the flag if you must minimize ingestion volume.
Key Configuration Flags
Understand the most important VictoriaMetrics flags:
-storageDataPath: Directory for storing all data (default:victoria-metrics-data)-retentionPeriod: Data retention period (default: 1 month, minimum: 24h)-selfScrapeInterval: Interval for self scraping metrics (optional but recommended)-httpListenAddr: Address to listen for HTTP connections (default::8428)
For high-performance environments, consider these additional flags:
- VictoriaMetrics ships with sensible defaults. I recommend only changing memory or concurrency flags after observing pressure via metrics such as
vm_memory_usage_bytesandvm_request_duration_seconds. Increasing limits (for example, raising-memory.allowedPercentor-search.maxConcurrentRequests) can accelerate heavy queries but risks starving the OS page cache or overloading CPU. Tweak them gradually and validate via load tests before adopting in production.
Docker Compose Stack
For a reproducible lab environment, place the following files in a new working directory (for example, victoriametrics-staging/).
-
Prepare the directory
mkdir -p victoriametrics-staging/prometheus cd victoriametrics-staging -
Create
docker-compose.ymlservices: victoria-metrics: image: victoriametrics/victoria-metrics:v1.126.0 command: - '--selfScrapeInterval=5s' - '--storageDataPath=/var/lib/victoria-metrics' - '--retentionPeriod=90d' ports: - '8428:8428' volumes: - victoria-metrics-data:/var/lib/victoria-metrics healthcheck: test: ['CMD', 'wget', '--spider', '-q', 'http://127.0.0.1:8428/-/healthy'] interval: 10s timeout: 5s retries: 5 prometheus: image: prom/prometheus:v3.6.0 command: - '--config.file=/etc/prometheus/prometheus.yml' - '--storage.tsdb.retention.time=15d' ports: - '9090:9090' volumes: - ./prometheus/prometheus.yml:/etc/prometheus/prometheus.yml:ro depends_on: victoria-metrics: condition: service_healthy grafana: image: grafana/grafana:12.2.0 ports: - '3000:3000' environment: GF_SECURITY_ADMIN_USER: admin GF_SECURITY_ADMIN_PASSWORD: admin GF_USERS_ALLOW_SIGN_UP: 'false' depends_on: victoria-metrics: condition: service_healthy volumes: victoria-metrics-data:Notes:
-
You can skip Prometheus and Grafana in this stack if you already have it running.
-
The self scrape flag makes VictoriaMetrics ingest its own
/metricsendpoint. Disable it if you need to minimize ingestion volume. -
The health check targets
http://127.0.0.1:8428/-/healthyto force IPv4 inside the container. Some minimal base images resolvelocalhostto IPv6 first, which can cause connection refusals. -
Here is a tip. Refresh image tags before deploying. To see the latest upstream releases use the
jqutility:curl -s https://api.github.com/repos/prometheus/prometheus/releases/latest | jq -r '.tag_name' curl -s https://api.github.com/repos/grafana/grafana/releases/latest | jq -r '.tag_name'Replace the
image:tags with the versions returned by those commands or the versions listed on GitHub release pages/Docker Hub.
-
-
Create
prometheus/prometheus.ymlin the same directoryglobal: scrape_interval: 15s evaluation_interval: 15s scrape_configs: - job_name: 'prometheus' static_configs: - targets: ['prometheus:9090'] - job_name: 'victoriametrics' static_configs: - targets: ['victoria-metrics:8428'] labels: service: victoria-metrics remote_write: - url: http://victoria-metrics:8428/api/v1/write write_relabel_configs: - target_label: prometheus_replica replacement: staging-prom-1 remote_read: - url: http://victoria-metrics:8428/api/v1/read read_recent: false # set true only if Prometheus must serve the freshest data from remote storage -
Bring the stack up
docker compose up -d    # or: docker-compose up -d
docker compose ps
You should see VictoriaMetrics, Prometheus, and Grafana in the
Upstate. The Grafana credentials default toadmin/admin. -
Validate service health
curl http://localhost:8428/-/healthy
curl http://localhost:9090/-/healthy
docker compose logs victoria-metrics | tail -n 20
The VictoriaMetrics health endpoint should return
VictoriaMetrics is Healthy. Prometheus logs confirm that remote write is active. checkprometheus_remote_storage_queue_highest_sent_timestamp_secondsfor progress. -
Tear down when finished
docker compose down
docker volume rm victoriametrics-staging_victoria-metrics-data  # remove persisted samples
Remove the named volume only if you do not need the retained metrics. If you used a different project directory, the volume prefix will change. run
docker volume lsto confirm before deleting.
After starting VictoriaMetrics (via docker run or the compose stack), you can access:
- Web UI (vmui): http://localhost:8428/vmui for graphical interface
- Health check: http://localhost:8428/-/healthy should return “VictoriaMetrics is Healthy”
- Metrics endpoint: http://localhost:8428/metrics to see VictoriaMetrics internal metrics
- API documentation: http://localhost:8428 for available HTTP endpoints
With -selfScrapeInterval=5s, VictoriaMetrics scrapes its own metrics, which become queryable about 30 seconds after startup.
Step 2: Configuring Prometheus Remote Write
Prometheus can be configured to write the samples it scrapes to a remote server. We can configure Prometheus to write to our new VictoriaMetrics server.
Updating Prometheus Configuration
Edit your prometheus.yml file to add the remote_write configuration:
global:
  scrape_interval: 15s
  evaluation_interval: 15s

# Your existing scrape configs remain unchanged
scrape_configs:
  - job_name: 'prometheus'
    static_configs:
      - targets: ['localhost:9090']

  - job_name: 'node-exporter'
    static_configs:
      - targets: ['localhost:9100']

# Add this section to enable remote write to VictoriaMetrics
remote_write:
  - url: http://your-victoriametrics-server:8428/api/v1/write
    write_relabel_configs:
      # Optional: Add labels to distinguish data sources
      - target_label: prometheus_replica
        replacement: prometheus-01
Replace your-victoriametrics-server with the hostname or IP address that exposes port 8428. If you are using the Docker Compose stack from Step 1, the sample file you created already points Prometheus at the victoria-metrics service name on the internal network.
Advanced Remote Write Configuration
Prometheus defaults (max_samples_per_send: 2000, capacity: 10000, max_shards: 50) handle most workloads. Increase them only after you observe persistent back-pressure in prometheus_remote_storage_* metrics. Larger buffers improve throughput on slow links but consume more Prometheus memory and delay retry feedback. If you raise limits, do so incrementally and validate under load tests.
Step 3: Configuring Remote Read (Optional)
To query historical data stored in VictoriaMetrics directly from Prometheus, configure remote read:
remote_read:
  - url: http://your-victoriametrics-server:8428/api/v1/read
    read_recent: false # set true only if you rely on remote data for the freshest samples
Trade-off: enabling
read_recentlets Prometheus query the newest samples from VictoriaMetrics but also increases CPU and memory consumption on both systems.
As with remote write, adjust the URL to match your deployment. The Compose example uses http://victoria-metrics:8428/api/v1/read on the internal network and disables read_recent by default.
This configuration allows Prometheus to query both local and remote data through the same API, providing a unified query experience.
Step 4: Validating the Setup
Checking Data Ingestion
After restarting Prometheus, verify that data is flowing to VictoriaMetrics:
# Check VictoriaMetrics metrics endpoint
curl http://your-victoriametrics-server:8428/metrics | grep vm_rows

# Query specific metrics to verify data ingestion
curl 'http://your-victoriametrics-server:8428/api/v1/query?query=up'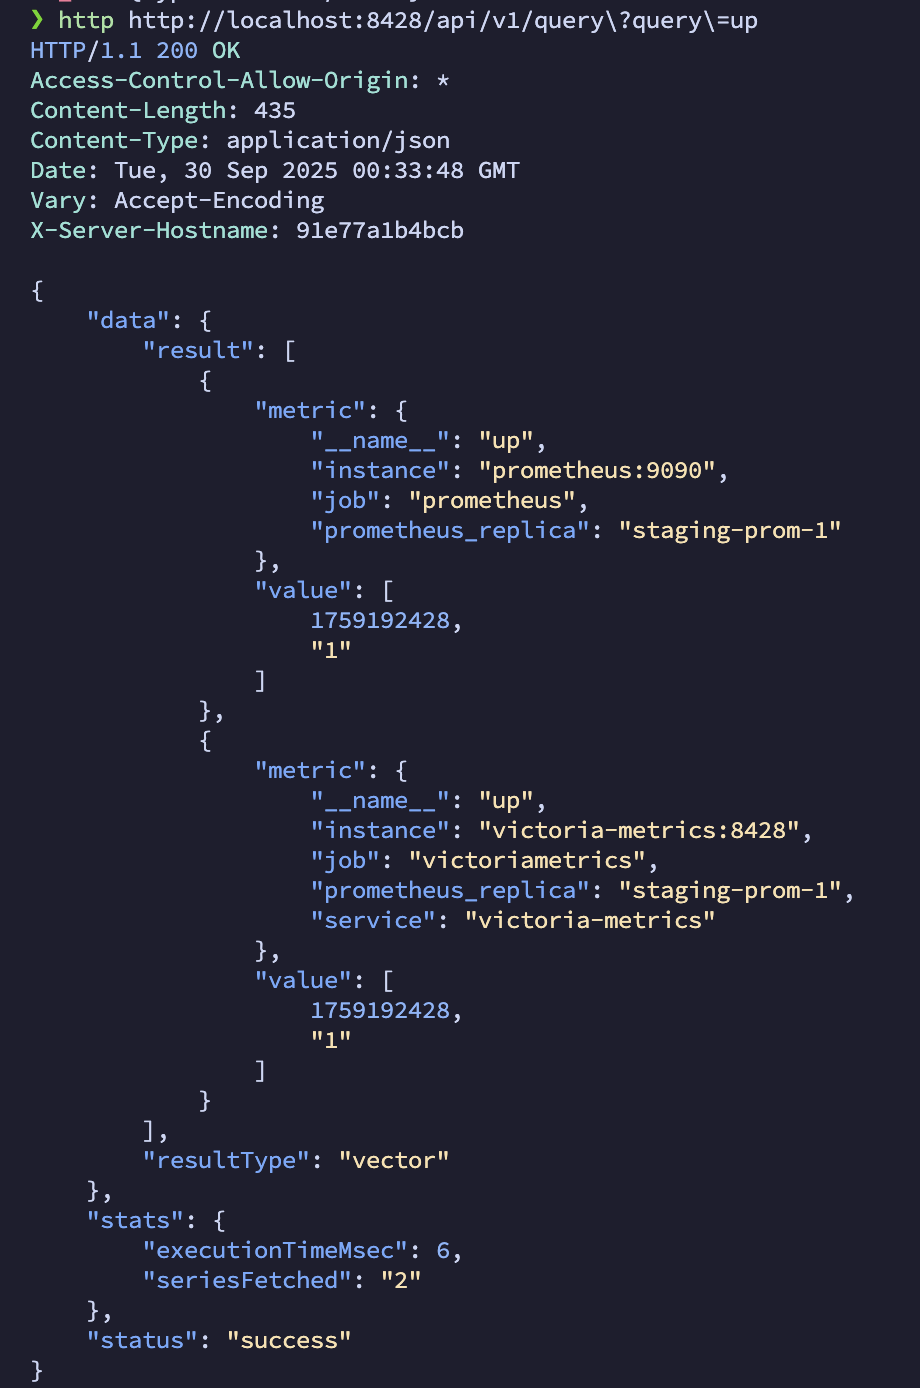
Monitoring VictoriaMetrics Performance
VictoriaMetrics exposes metrics in Prometheus format:
# Check ingestion rate
curl 'http://your-victoriametrics-server:8428/api/v1/query?query=rate(vm_rows_inserted_total[5m])'

# Monitor storage usage
curl 'http://your-victoriametrics-server:8428/api/v1/query?query=vm_data_size_bytes'
Step 5: Integrating with Grafana
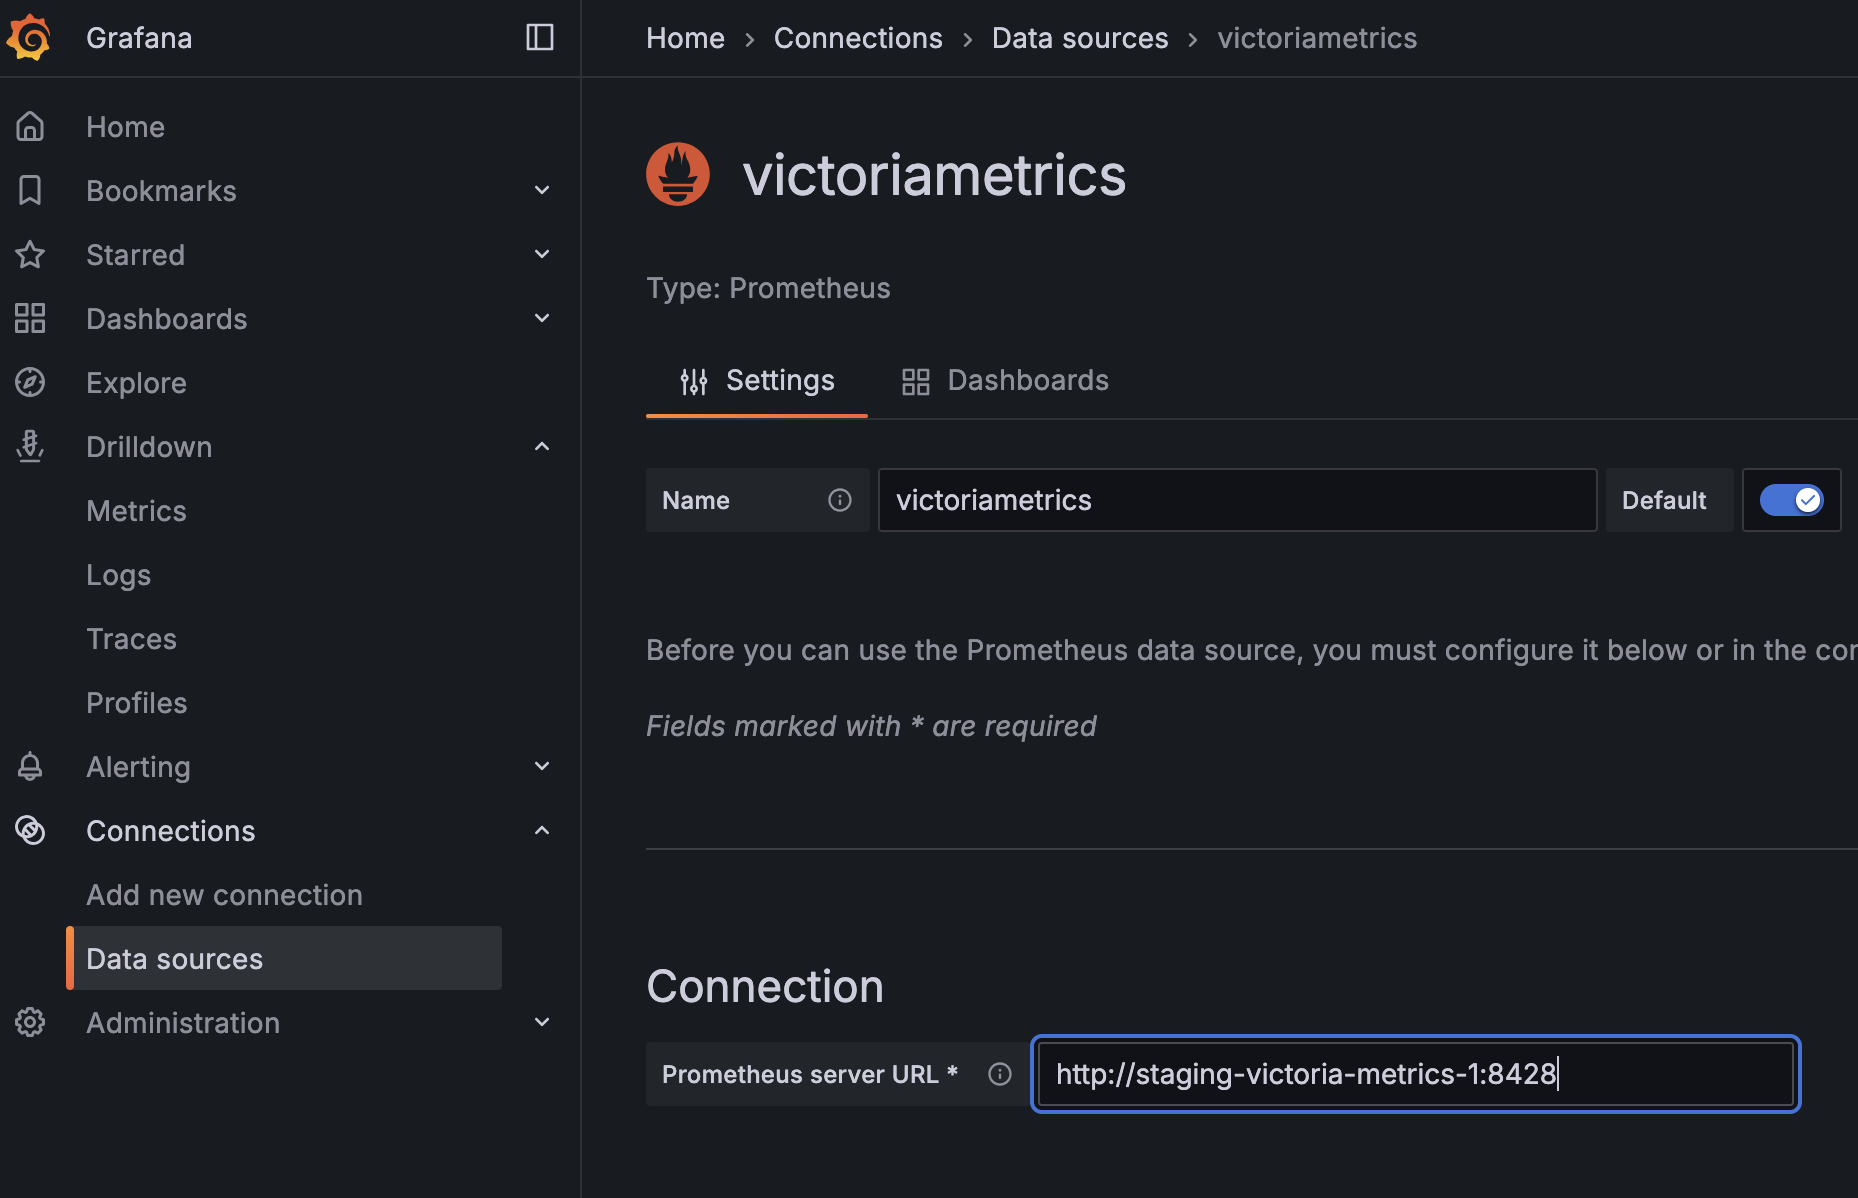
VictoriaMetrics exposes the same HTTP API shape Grafana expects from Prometheus. Add a new data source with these settings:
- URL:
http://your-victoriametrics-server:8428 - Access: Server (default)
- HTTP Method: GET
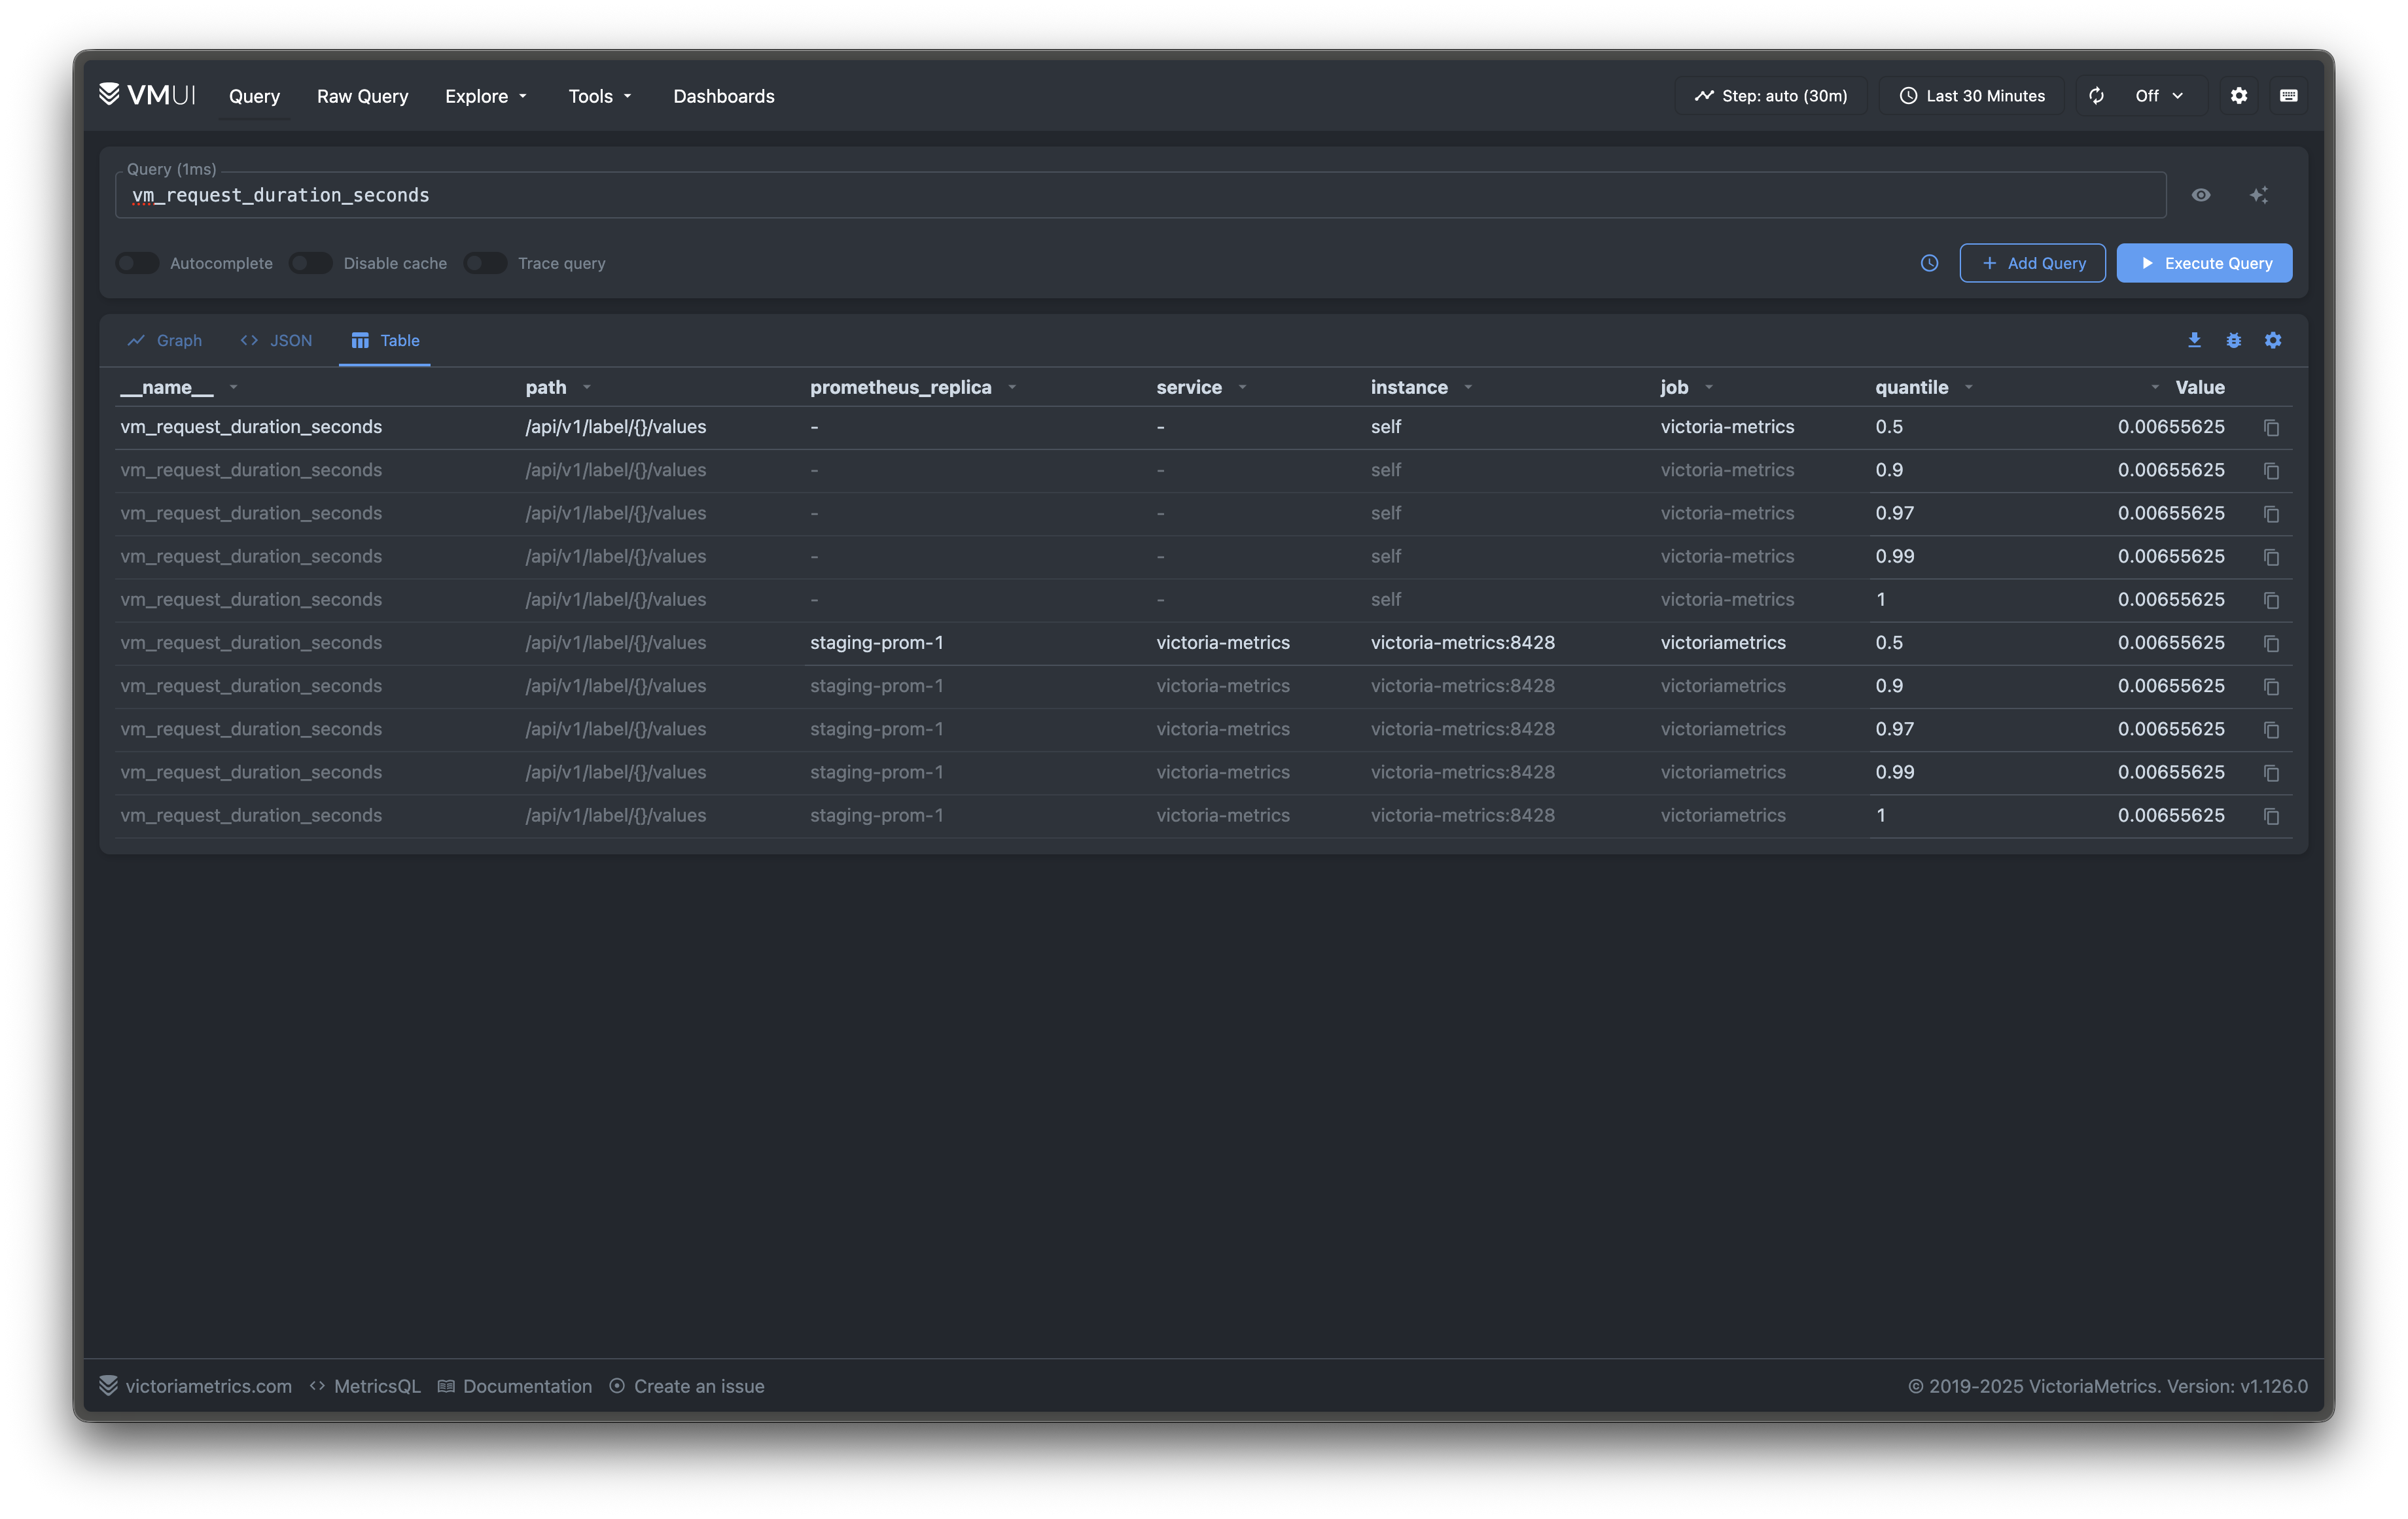
Existing dashboards continue to work as long as they rely on PromQL compatible queries. Measure query timings with the metric vm_request_duration_seconds.
Performance Optimization Tips
1. Storage Configuration
- Keep
-storageDataPathon fast, local disks to minimize read latency. Network storage can work, but latency spikes will hurt query performance. - Set
-retentionPeriodaccording to compliance needs. Longer retention increases disk usage. confirm capacity by watchingvm_data_size_bytes. - Back up data via the snapshot API or
vmbackupbefore making major changes to retention.
If you need to tune ingestion or query flags (-memory.allowedPercent, -search.maxConcurrentRequests, -insert.maxQueueDuration), treat them as advanced options: increasing them may improve throughput but can also elevate memory pressure or request latency. Adjust one flag at a time and monitor VictoriaMetrics dashboards to verify the impact.
If you need to back up your metrics, a tool vmbackup is available for automated backup solutions.
2. Query Optimization
VictoriaMetrics supports advanced PromQL features that can significantly improve query performance:
# Use histogram_quantile with le label for better performance
histogram_quantile(0.95, rate(http_request_duration_seconds_bucket[5m]))

# Leverage VictoriaMetrics' enhanced functions
rollup_rate(cpu_usage[5m:1m])  # More efficient than rate()
Monitoring Your VictoriaMetrics Installation
VictoriaMetrics exposes Prometheus compatible metrics. Start with these queries:
# Check ingestion rate
curl 'http://your-victoriametrics-server:8428/api/v1/query?query=rate(vm_rows_inserted_total[5m])'

# Monitor active series
curl 'http://your-victoriametrics-server:8428/api/v1/query?query=vm_cache_entries{type="storage/tsid"}'

# Check memory usage
curl 'http://your-victoriametrics-server:8428/api/v1/query?query=process_resident_memory_bytes'

# Monitor disk usage
curl 'http://your-victoriametrics-server:8428/api/v1/query?query=vm_data_size_bytes'
Important Concepts
Understanding these key concepts is crucial for VictoriaMetrics deployments (Prometheus behaves similar):
- Active Series: Currently receiving data points (affects memory usage)
- Churn Rate: Rate at which time series stop receiving data and new ones start
- Cardinality: Number of unique time series combinations
- Slow Inserts: Ingestion operations taking longer than expected
All these metrics are available in the official VictoriaMetrics Grafana dashboards.
When to Consider VictoriaMetrics Cluster
While this guide focuses on single-node deployment, VictoriaMetrics also ships a cluster version for horizontal scaling. Evaluate it and alternatives such as Thanos, Cortex, or Mimir if a single server can no longer meet your retention, availability, or tenancy requirements.
Consider the cluster version only if:
- You need to store more data than a single server can physically accommodate
- You require geographic distribution of storage nodes
- You need higher availability than what single-node with backup/restore can provide
Next Steps
At this point VictoriaMetrics is ingesting data from Prometheus, exposing metrics for validation, and serving queries to Grafana. Due to the way I have my network segmented, I believe I will start storing metrics on VictoriaMetrics and keep short retention periods on my Prometheus servers. Especially since one is running on a Raspberry Pi.