welcome
aj's blog
A personal blog focused on software, technology, and the cloud. Sharing what I'm working with at home — what broke, what stayed up, and what I learned getting it there.
recent
[INFO] 6 most recent · sorted by date desc
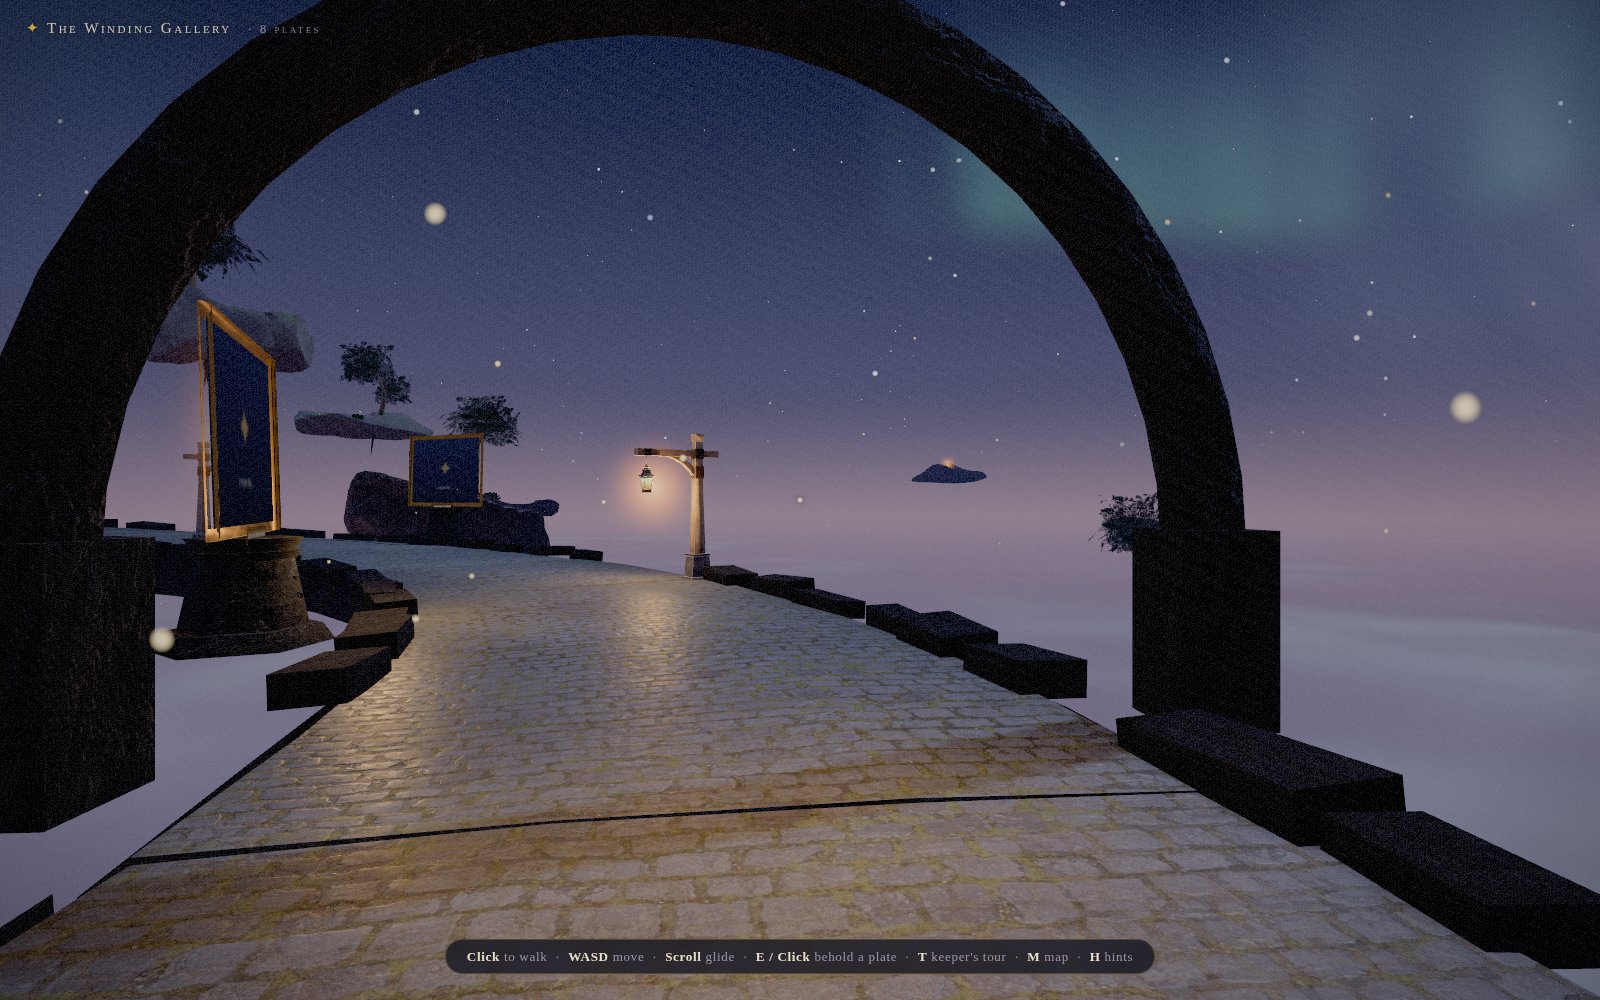
I built a fantasy 3D photo gallery with Claude Code: point it at any folder of photos and they hang in an endless moonlit night, with a guided tour mode that turns a TV into an exhibition of your own photography.
Deploy Hermes Agent on k3s with Argo CD, a local Gemma 4 model in Ollama, declarative configuration, Bitwarden-managed Telegram credentials, and SearXNG meta search.
A concise timeline of how my AI workflow moved from ChatGPT and local models to coding agents, model choice, and parallel agent orchestration.
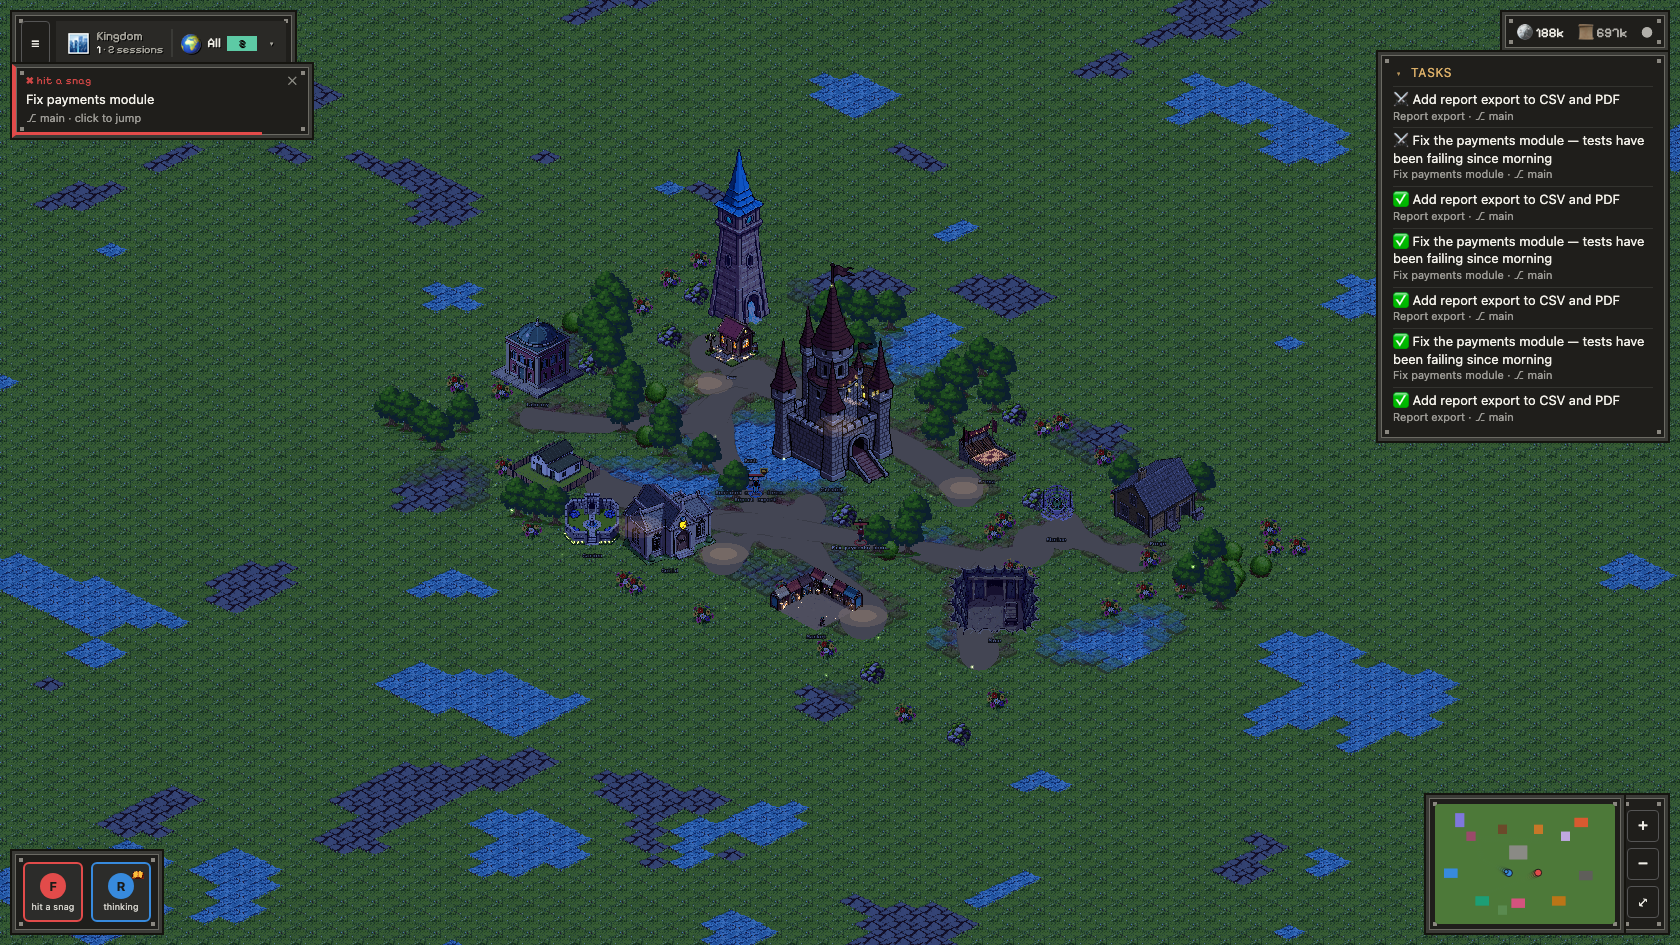
How I forked Age of Agents into Agent Hollow. a rebrand, a day/night cycle, buildings lit from the inside, fireflies, and a tokenless npm release pipeline.
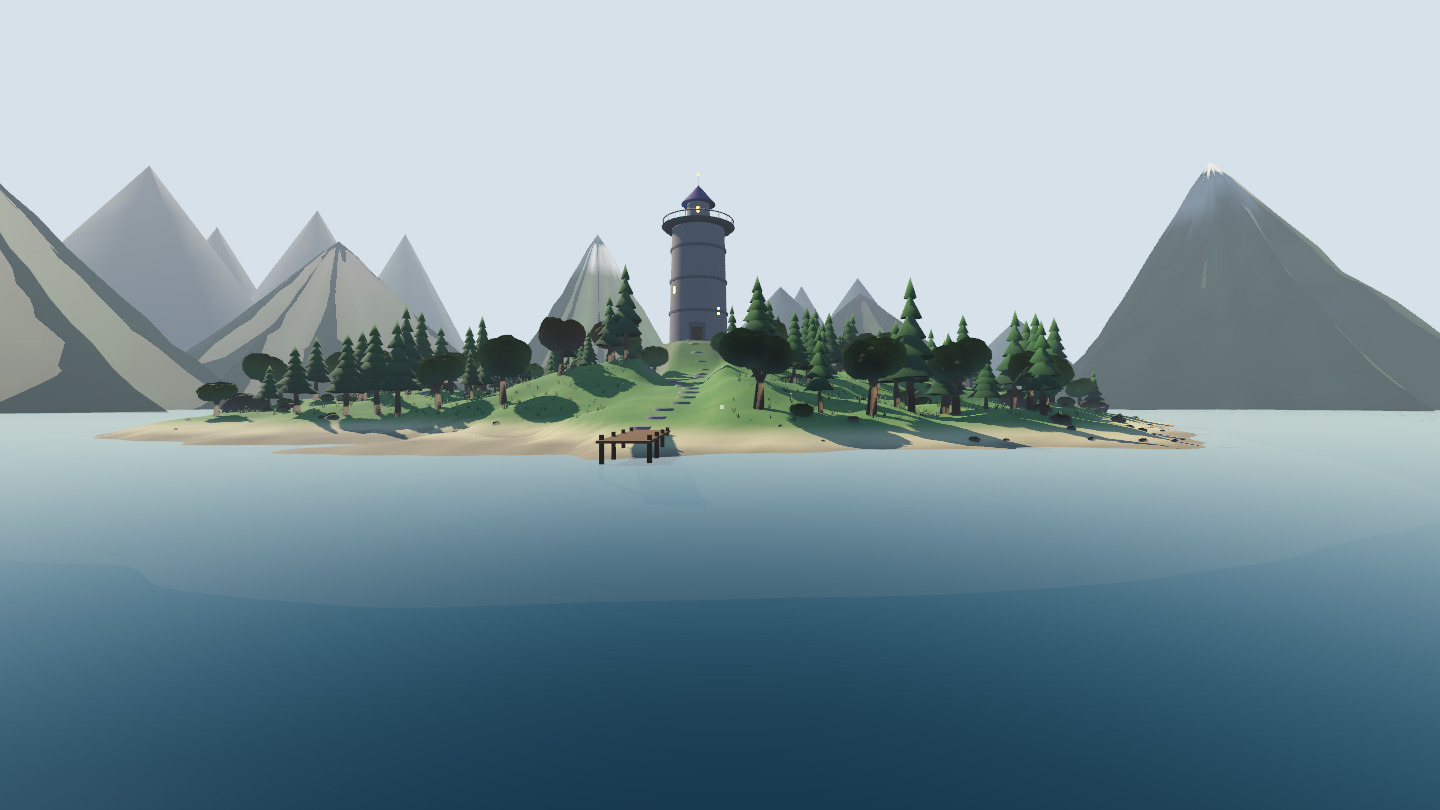
Three weeks ago Fable 5 vanished mid-project by government directive. Access is back, and the little Myst-like game it left behind now has a boat, a forest, a ruin, and secrets. A follow-up on what we built.
Install the Headlamp Kubernetes dashboard with Helm, log in safely, and run it either read-only or as a secure admin interface.
[NOTE] view all 171 posts · feed at /rss.xml