Monitor IP services with prometheus blackbox exporter
updated: 2025-12-02: I made some adjustments to blackbox so that you are less likely to be throttled for constantly pinging popular websites like GitHub and Reddit.
Blackbox exporter is used by Prometheus to monitor HTTP(S), TCP, DNS, and ICMP endpoints. If you are not familiar with prometheus, check out a previous post. The blackbox program will collect metrics and make them available on a http server. Prometheus needs to be configured to collect metrics from the blackbox exporter and then grafana can be used to visualize those metrics.
Configure blackbox
Blackbox is configured with a .yml file. The file below should be mounted inside the container. This example defines multiple modules for different monitoring scenarios: ICMP for simple ping checks, http_head_public for monitoring public websites with lightweight HEAD requests, http_get_lan for internal services with full GET requests, and DNS for DNS query monitoring. All modules use IPv4, timeout after 5 seconds, and accept 2xx/3xx status codes by default. This file will be in the same directory as the main prometheus config if you follow from the previous post.
blackbox.yml
modules:
  # Simple ICMP ping
  icmp:
    prober: icmp
    timeout: 5s
    icmp:
      preferred_ip_protocol: 'ip4'

  # HTTP for PUBLIC sites: HEAD + lightweight path (robots.txt)
  http_head_public:
    prober: http
    timeout: 5s
    http:
      method: HEAD
      valid_http_versions: ['HTTP/1.1', 'HTTP/2.0']
      valid_status_codes: [] # 2xx and 3xx by default
      preferred_ip_protocol: 'ip4'
      no_follow_redirects: false
      tls_config:
        insecure_skip_verify: false

  # HTTP for LAN/internal services: full GET request
  http_get_lan:
    prober: http
    timeout: 5s
    http:
      method: GET
      valid_http_versions: ['HTTP/1.1', 'HTTP/2.0']
      valid_status_codes: [] # accept 2xx/3xx
      preferred_ip_protocol: 'ip4'
      no_follow_redirects: false
      tls_config:
        insecure_skip_verify: false # flip to false if you have valid certs

  # DNS query module (if you want it)
  dns:
    prober: dns
    timeout: 5s
    dns:
      query_name: 'google.com'
      query_type: 'A'
Install blackbox with docker
There is an existing container image to run the blackbox exporter. This needs to be added to the same container network where a prometheus server container is running. See the previous post on prometheus for a complete docker-compose template. Ensure the config file exists before starting the stack; using a relative bind mount keeps the example portable across Operating Systems.
docker-compose.yml
services:
  blackbox:
    image: prom/blackbox-exporter:v0.27.0 # this is the latest image tag as of December 2025
    container_name: blackbox-exporter
    command:
      - '--config.file=/config/blackbox.yml'
    ports:
      - 9115:9115
    volumes:
      - ./blackbox.yml:/config/blackbox.yml:ro
    restart: unless-stopped
The important note here is the volumes: key. First is the location of the blackbox config file on the host machine delimited with a : and inside the container, the config will be mounted in the container filesystem as /config/blackbox.yml. Second thing to verify is the command: key. We need to point blackbox towards the config file.
Start the new container after updating docker-compose.yml. The tool will detect the new container and bring it up without disrupting other running containers:
docker compose up -dConfigure prometheus server
Once blackbox exporter is running, the prometheus server needs to be configured to monitor the new exporter. This is where you specify the sites that you want to monitor and which module to use for each. The configuration below uses three separate jobs: ICMP probes for general network monitoring, HTTP probes for public sites using lightweight HEAD requests with extended intervals to avoid throttling, and DNS probes for DNS availability checking. Update the prometheus server config:
prometheus.yml
#Other jobs above
# ICMP probes (ping-like monitoring)
- job_name: 'blackbox-icmp'
  scrape_interval: 30s
  metrics_path: /probe
  params:
    module: [icmp]
  static_configs:
    - targets:
        - 8.8.8.8 # Google DNS
        - 1.1.1.1 # Cloudflare DNS
        - google.com
        - github.com
  relabel_configs:
    - source_labels: [__address__]
      target_label: __param_target
    - source_labels: [__param_target]
      target_label: instance
    - target_label: __address__
      replacement: localhost:9115
# HTTP probes for public websites (HEAD requests to reduce throttling)
- job_name: 'blackbox-http-public'
  scrape_interval: 90s # Extended interval to avoid throttling public sites
  metrics_path: /probe
  params:
    module: [http_head_public]
  static_configs:
    - targets:
        - https://www.google.com/robots.txt
        - https://github.com/robots.txt
        - https://www.reddit.com/robots.txt
  relabel_configs:
    - source_labels: [__address__]
      target_label: __param_target
    - source_labels: [__param_target]
      target_label: instance
    - target_label: __address__
      replacement: localhost:9115
# HTTP probes for internal/LAN services (full GET requests)
- job_name: 'blackbox-http-lan'
  scrape_interval: 30s
  metrics_path: /probe
  params:
    module: [http_get_lan]
  static_configs:
    - targets:
        - https://internal.example.com # replace these
        - https://192.168.1.100:8443 # with your systems that are on a local network
  relabel_configs:
    - source_labels: [__address__]
      target_label: __param_target
    - source_labels: [__param_target]
      target_label: instance
    - target_label: __address__
      replacement: localhost:9115
# DNS probes for DNS server availability
- job_name: 'blackbox-dns'
  scrape_interval: 60s
  metrics_path: /probe
  params:
    module: [dns]
  static_configs:
    - targets:
        - 1.1.1.1
        - 8.8.8.8
  relabel_configs:
    - source_labels: [__address__]
      target_label: __param_target
    - source_labels: [__param_target]
      target_label: instance
    - target_label: __address__
      replacement: localhost:9115
Visualize new metrics with pre-made grafana dashboard
The aforementioned post included deploying grafana. Check it out for help getting grafana running. There are free dashboards available online:
https://grafana.com/grafana/dashboards/
There is a dashboard for blackbox exporter.
At this time it has the ID 7587.
-
Navigate to the left-hand menu and Select ”+” > “Import” > “Import via grafana.com”
-
Enter the ID of the dashboard you would like to import and then select “Load”
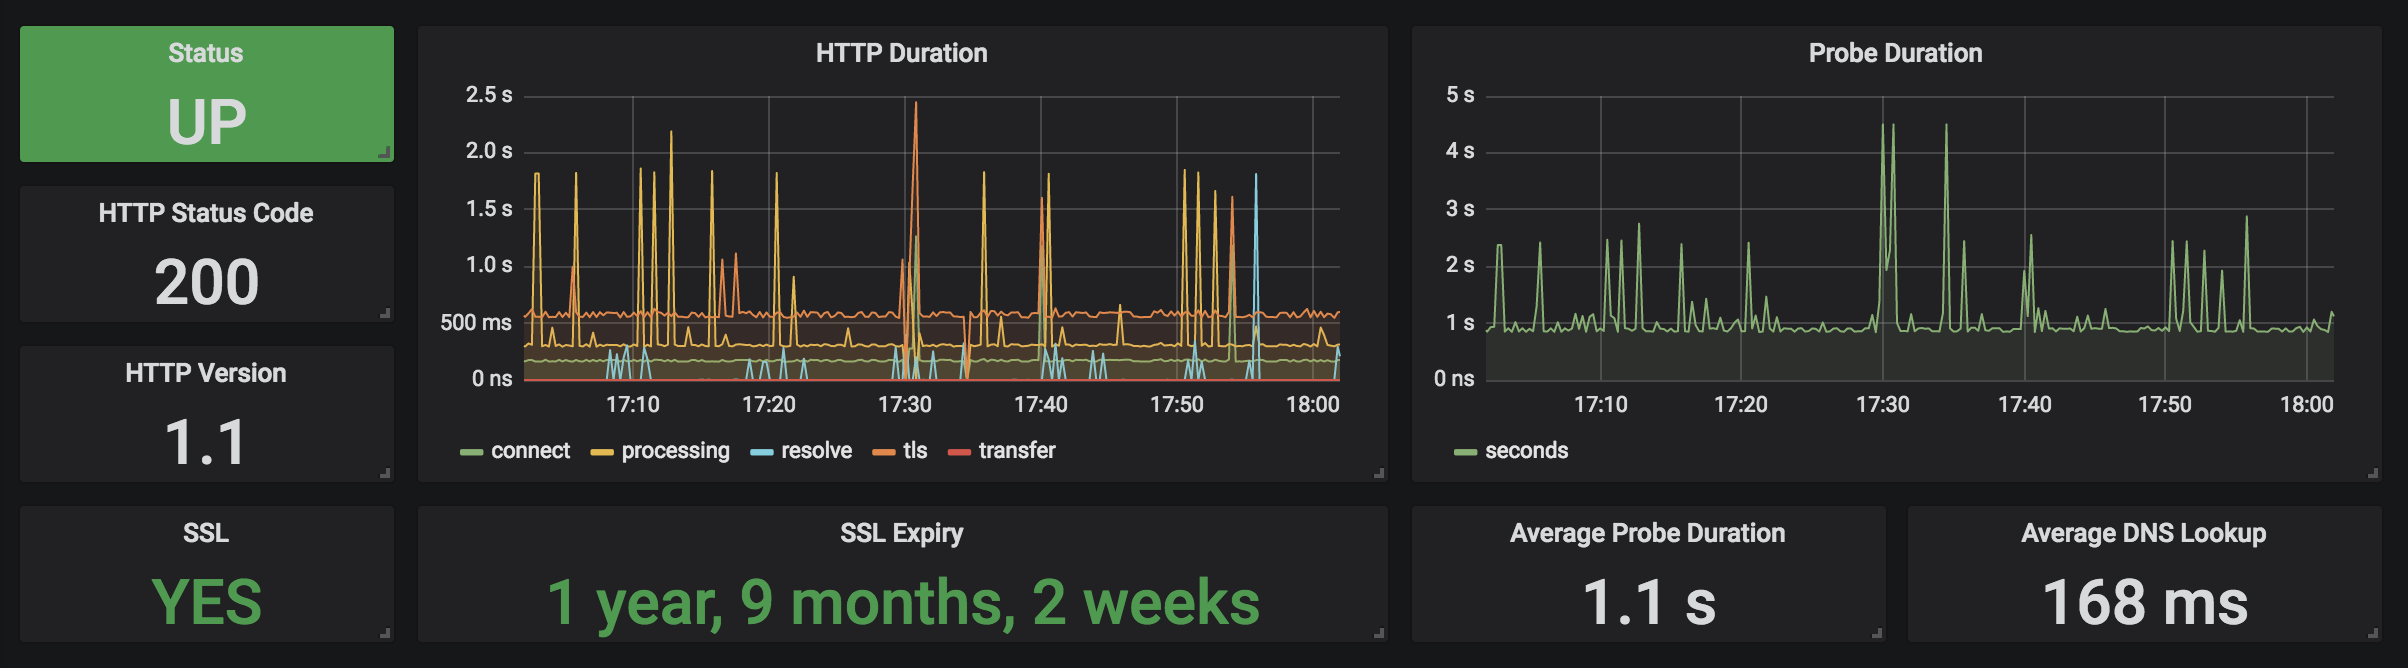
-
You should now see a dashboard like below.