cadvisor for arm64
update 2025: added some notes for using different cpu architectures
update 2024: the official cadvisor image now supports arm which means it will work on Pis
![]() cadvisor exporter, maintained by Google, is used by Prometheus to monitor container metrics. If you are not familiar with Prometheus, check out a previous post. The cadvisor golang program will collect metrics and make them available on a http server. Prometheus needs to be configured to collect metrics from the cadvisor exporter and then Grafana can be used to visualize those metrics.
cadvisor exporter, maintained by Google, is used by Prometheus to monitor container metrics. If you are not familiar with Prometheus, check out a previous post. The cadvisor golang program will collect metrics and make them available on a http server. Prometheus needs to be configured to collect metrics from the cadvisor exporter and then Grafana can be used to visualize those metrics.
Run container image
The container can be deployed with docker-compose. Some metrics are disabled, notably the memory metrics on arm cpus. Make sure that the cadvisor container is on the same docker network as prometheus server.
docker-compose.yml
services:
  cadvisor:
    image: gcr.io/cadvisor/cadvisor
    container_name: cadvisor
    ports:
      - '8080:8080'
    volumes:
      - /:/rootfs:ro
      - /var/run:/var/run:ro
      - /sys:/sys:ro
      - /var/lib/docker/:/var/lib/docker:ro
      - /dev/disk/:/dev/disk:ro
    devices:
      - /dev/kmsg
    restart: unless-stopped
Note: the main image is multi-arch but you can add a specific tag if you know you need an arm or arm64 image.
You can specify your desired CPU architecture in the image tag. That is a way you ensure you get the image for an arm CPU on the Raspberry Pi.
For example use the image tag: gcr.io/cadvisor/cadvisor-arm:${VERSION} or gcr.io/cadvisor/cadvisor-arm64:${VERSION}
Start the new container after updating docker-compose.yml.
docker compose up -dOnce the container is running, skip the next section about building the image from source code.
Build container image
note: as of 2024 you do not need to build the image from source code. This section can be skipped. check the official repo for updates to the Dockerfile
The existing official image for cadvisor used to not have a image published for the arm cpu architecture. This is what is found in a Raspberry Pi CPU and in Apple’s M series CPUs.
The same source code can be used to build a compatible image and run it alongside other containers on an arm system. The following code was found on a github issue for the cadvisor github repository.
First prepare the container image with a Dockerfile:
FROM golang:buster AS builder
ARG VERSION

RUN apt-get update \
 && apt-get install make git bash gcc \
 && mkdir -p $GOPATH/src/github.com/google \
 && git clone https://github.com/google/cadvisor.git $GOPATH/src/github.com/google/cadvisor

WORKDIR $GOPATH/src/github.com/google/cadvisor
RUN git fetch --tags \
 && git checkout $VERSION \
 && go env -w GO111MODULE=auto \
 && make build \
 && cp ./cadvisor /

# ------------------------------------------
# Copied over from deploy/Dockerfile except that the "zfs" dependency has been removed
# a its not available fro Alpine on ARM
FROM alpine:latest
MAINTAINER dengnan@google.com vmarmol@google.com vishnuk@google.com jimmidyson@gmail.com stclair@google.com

RUN sed -i 's,https://dl-cdn.alpinelinux.org,http://dl-4.alpinelinux.org,g' /etc/apk/repositories

RUN apk --no-cache add libc6-compat device-mapper findutils thin-provisioning-tools && \
    echo 'hosts: files mdns4_minimal [NOTFOUND=return] dns mdns4' >> /etc/nsswitch.conf && \
    rm -rf /var/cache/apk/*

# Grab cadvisor from the staging directory.
COPY --from=builder /cadvisor /usr/bin/cadvisor

EXPOSE 8080

HEALTHCHECK --interval=30s --timeout=3s \
  CMD wget --quiet --tries=1 --spider http://localhost:8080/healthz || exit 1

ENTRYPOINT ["/usr/bin/cadvisor", "-logtostderr"]
The container can be deployed with docker-compose. Some metrics are disabled, notably the memory metrics. Make sure that the cadvisor container is on the same docker network as prometheus server.
docker-compose.yml
version: '3.6'
services:
  cadvisor:
    container_name: cadvisor
    image: 127.0.0.1:5000/cadvisor
    build:
      context: ./cadvisor
      dockerfile: Dockerfile
      args:
        VERSION: 'v0.44.0'
      cache_from:
        - golang:buster
        - alpine:latest
    command:
      - '--allow_dynamic_housekeeping=true'
      - '--housekeeping_interval=30s'
      - '--docker_only=true'
      - '--storage_duration=1m0s'
      - '--event_storage_age_limit=default=0'
      - '--event_storage_event_limit=default=0'
      - '--global_housekeeping_interval=30s'
      - '--disable_metrics=accelerator,cpu_topology,disk,memory_numa,tcp,udp,percpu,sched,process,hugetlb,referenced_memory,resctrl,cpuset,advtcp,memory_numa'
      - '--store_container_labels=false'
    restart: unless-stopped
    devices:
      - /dev/kmsg:/dev/kmsg
    expose:
      - 8080
    volumes:
      - /:/rootfs:ro
      - /var/run:/var/run:rw
      - /sys:/sys:ro
      - /var/lib/docker/:/var/lib/docker:ro
      - /etc/machine-id:/etc/machine-id:ro
Start the new container after updating docker-compose.yml. The tool will detect the new container and bring it up without disrupting other running containers:
docker compose up -dConfigure prometheus server
Once cadvisor is running, the prometheus server needs to be configured to monitor the new exporter. When cadvisor and prometheus are on the same container network, you can configure the target for cadvisor with just the name of the container. Update the prometheus server config:
/etc/prometheus/prometheus.yml
#Other jobs above
- job_name: 'cadvisor'
  static_configs:
    - targets: ['cadvisor:8080']
Restart the prometheus container to start scraping the new target.
docker restart prometheus
Visualize new metrics with pre-made grafana dashboard
The aforementioned post included deploying grafana. Check it out for help getting grafana running. There are free dashboards available online:
https://grafana.com/grafana/dashboards/
There is a dashboard for cadvisor.
At this time it has the ID 11600.
-
Navigate to the left-hand menu and Select ”+” > “Import” > “Import via grafana.com”
-
Enter the ID of the dashboard you would like to import and then select “Load”
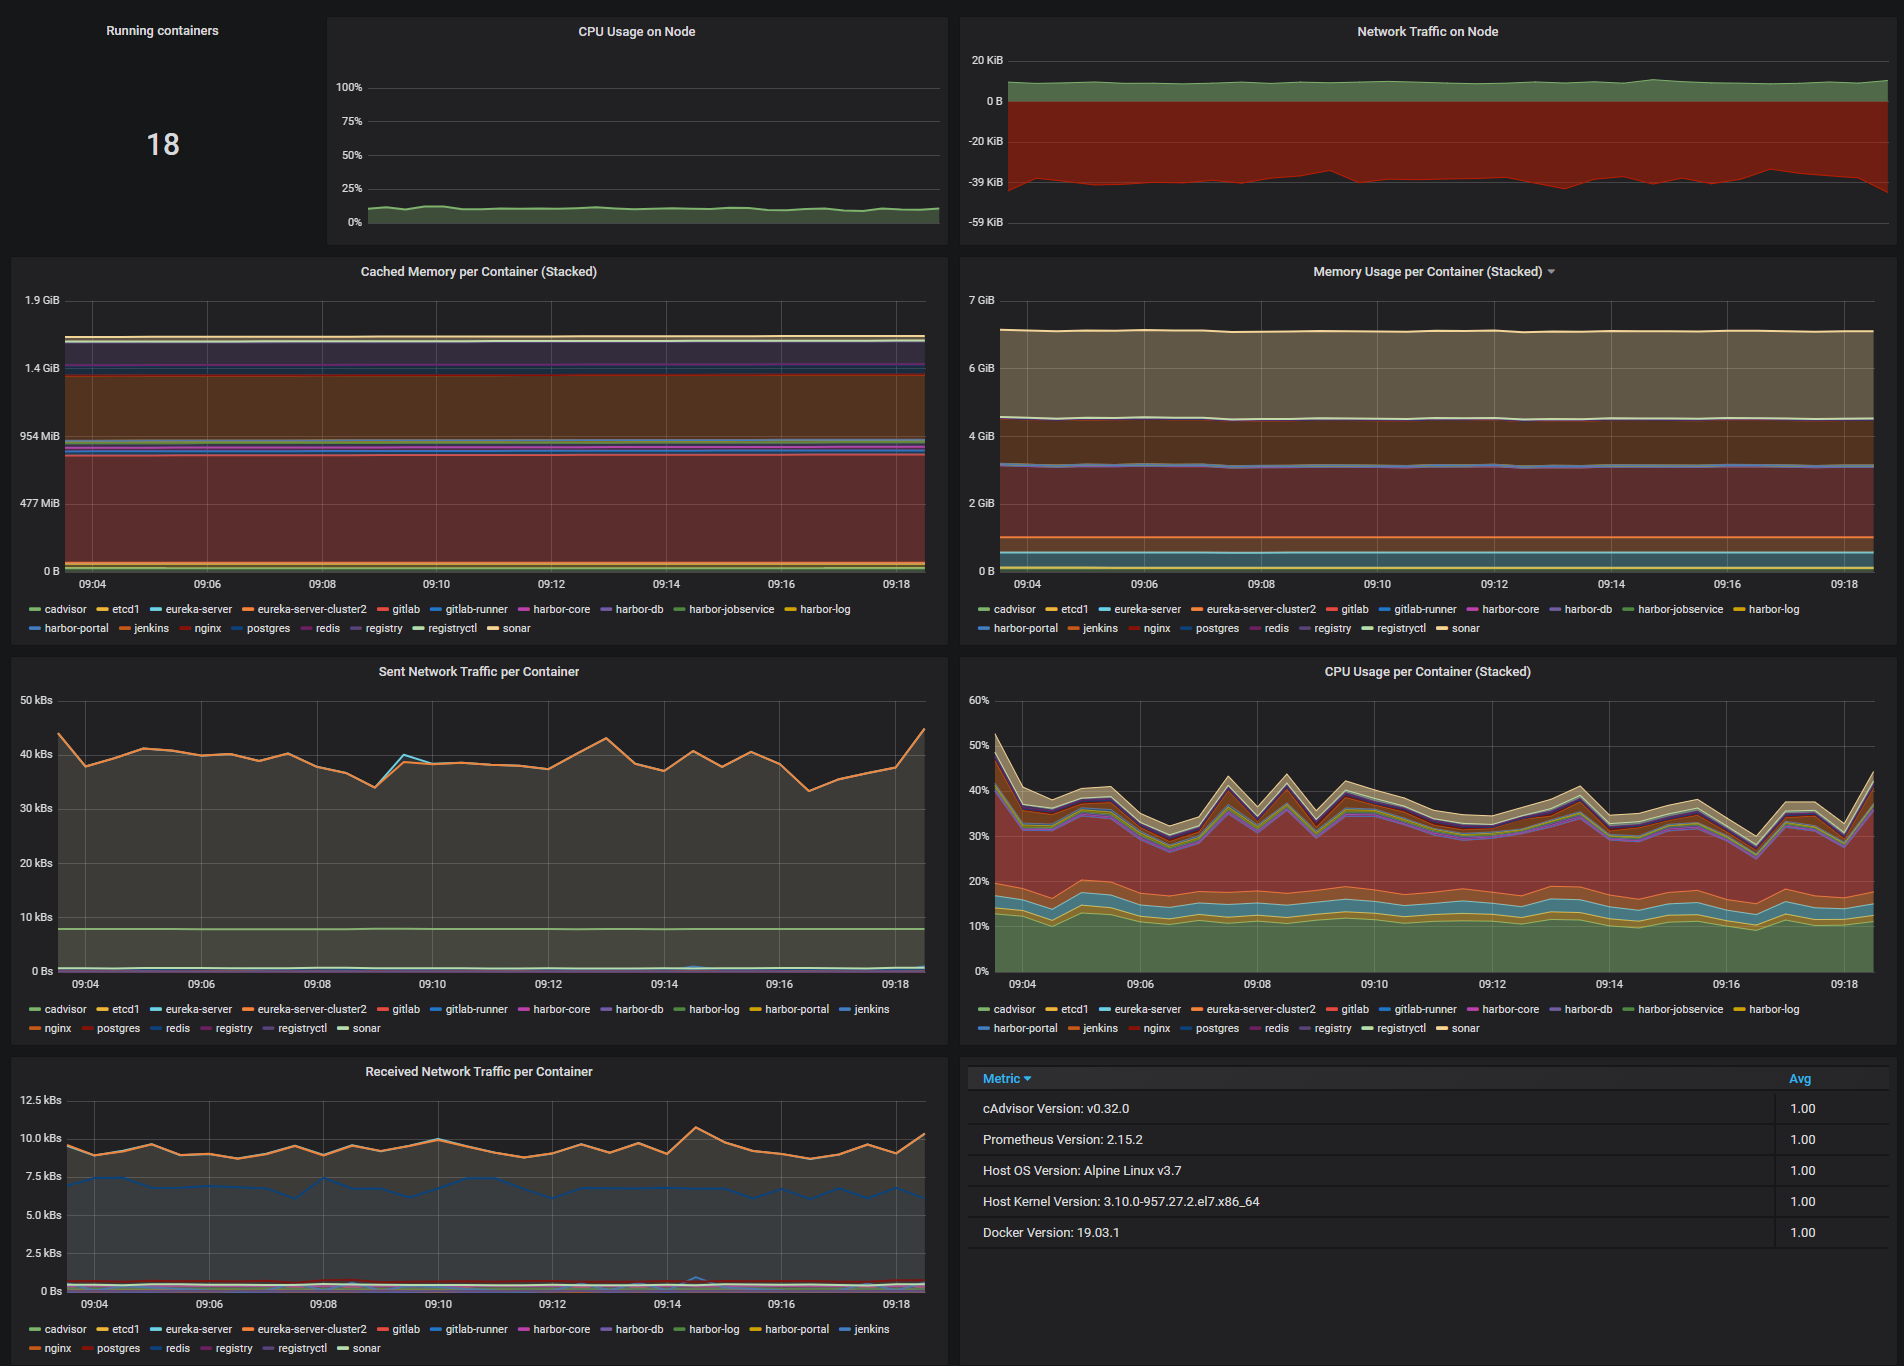
-
You should now see a dashboard like below.