Monitor Debian Linux with Grafana Alloy
I have most systems using grafana alloy for logs that send to a loki server. It can also collect metrics and eliminate the prometheus node exporter as a separate install. In a previous post I migrated my systems that used Grafana Promtail -> Grafana Alloy. I have used those projects to collect log events from my Linux servers at home. They can also collect logs from Docker containers and forward log events to another server which in an older post I set up Grafana Loki to store log events from all of my servers, containers, and applications that could support this system.
I also use Prometheus to collect metrics from my servers and applications. One possible function of the Grafana Alloy project, which I understand is based on OpenTelemetry, is to also collect metrics in addition to how I have configured it to collect logs. Certain metrics such as those on the system where Alloy is running can be collected without running additional software such as the Prometheus node exporter. Now this is worth noting that you will be pushing metrics to a remote Prometheus server instead of configuring Prometheus to scrape your Grafana Alloy server. There are metrics for the Alloy server that run on a port that can be scraped by Prometheus or Alloy can write internal metrics to a remote Prometheus server. If you are not familiar with Prometheus, I have several posts on various ways to set it up, see /tags/prometheus
Grafana Alloy Setup Guide for Debian
This guide walks you through installing and configuring Grafana Alloy to collect logs and metrics on a Debian server. I recently upgraded my Proxmox (which are Debian based) servers to release “trixie” and I want to install Alloy directly on the servers instead of installing Docker daemon on my Proxmox servers. I prefer to provision a virtual machine inside Proxmox and then run Docker containers inside the Virtual Machine for easy backup, restoration, and isolation from the actual hosting server. That is out of scope for today but if you are not familiar with virtual machines, check out a previous post for an example of how to get started on your laptop or desktop.
What is Grafana Alloy?
Grafana Alloy is an open-source OpenTelemetry Collector distribution with built-in Prometheus pipelines. It supports collecting metrics, logs, traces, and profiles with programmable pipelines.
Installation
When running commands remotely, I recommend using screen or tmux to start a terminal session that can be resumed if your connection is interrupted.
Step 1: Install GPG (if not already installed)
sudo apt-get update
sudo apt-get install -y gpg
Step 2: Add Grafana Repository
# Create directory for keyrings if it does not already exist
sudo mkdir -p /etc/apt/keyrings/

# Download and add Grafana GPG key
wget -q -O - https://apt.grafana.com/gpg.key | gpg --dearmor | sudo tee /etc/apt/keyrings/grafana.gpg > /dev/null

# Add Grafana repository
echo "deb [signed-by=/etc/apt/keyrings/grafana.gpg] https://apt.grafana.com stable main" | sudo tee /etc/apt/sources.list.d/grafana.list
Step 3: Install Alloy
# Update package list
sudo apt-get update

# Install Grafana Alloy
sudo apt-get install -y alloy
Step 4: Start and Enable Alloy
# Start and enable the Alloy service
sudo systemctl enable --now alloy

# Check service status
sudo systemctl status alloy
Configuration
Once alloy is running, the default config will be loaded at /etc/alloy/config.alloy.
Basic Configuration Example
In order to collect all the logs and metrics we want, we need to create or override the default config file at at /etc/alloy/config.alloy.
Here’s a complete example that collects both system metrics and logs:
// Logging configuration for alloy
logging {
  level  = "info"
  format = "logfmt"
}

// =============================================================================
// METRICS COLLECTION
// =============================================================================

// This block relabels metrics coming from node_exporter to add standard labels
discovery.relabel "integrations_node_exporter" {
  targets = prometheus.exporter.unix.integrations_node_exporter.targets

  rule {
    // Set the instance label to the hostname of the machine
    target_label = "instance"
    replacement  = constants.hostname
  }

  rule {
    // Set a standard job name for all node_exporter metrics
    target_label = "job"
    replacement = "integrations/node_exporter"
  }
}

// Configure the node_exporter integration to collect system metrics
prometheus.exporter.unix "integrations_node_exporter" {
  // Disable unnecessary collectors to reduce overhead
  disable_collectors = ["ipvs", "btrfs", "infiniband", "xfs", "zfs"]
  enable_collectors = ["meminfo"]

  filesystem {
    // Exclude filesystem types that aren't relevant for monitoring
    fs_types_exclude     = "^(autofs|binfmt_misc|bpf|cgroup2?|configfs|debugfs|devpts|devtmpfs|tmpfs|fusectl|hugetlbfs|iso9660|mqueue|nsfs|overlay|proc|procfs|pstore|rpc_pipefs|securityfs|selinuxfs|squashfs|sysfs|tracefs)$"
    // Exclude mount points that aren't relevant for monitoring
    mount_points_exclude = "^/(dev|proc|run/credentials/.+|sys|var/lib/docker/.+)($|/)"
    // Timeout for filesystem operations
    mount_timeout        = "5s"
  }

  netclass {
    // Ignore virtual and container network interfaces
    ignored_devices = "^(veth.*|cali.*|[a-f0-9]{15})$"
  }

  netdev {
    // Exclude virtual and container network interfaces from device metrics
    device_exclude = "^(veth.*|cali.*|[a-f0-9]{15})$"
  }


}

// Define how to scrape metrics
prometheus.scrape "integrations_node_exporter" {
scrape_interval = "15s"
  // Use the targets with labels from the discovery.relabel component
  targets    = discovery.relabel.integrations_node_exporter.output
  // Send the scraped metrics to the relabeling component
  forward_to = [prometheus.remote_write.metrics_service.receiver]
}

// scrape alloy application metrics
prometheus.exporter.self "integrations_alloy_health" { }

discovery.relabel "integrations_alloy_health" {
	targets = prometheus.exporter.self.integrations_alloy_health.targets

	rule {
		target_label = "instance"
		replacement  = constants.hostname
	}
}

prometheus.scrape "integrations_alloy_health" {
	targets = array.concat(
		discovery.relabel.integrations_alloy_health.output,
	)
	forward_to = [prometheus.relabel.integrations_alloy_health.receiver]
	job_name   = "integrations/alloy"
}

prometheus.relabel "integrations_alloy_health" {
	forward_to = [prometheus.remote_write.metrics_service.receiver]
}

// Send metrics to Prometheus
prometheus.remote_write "metrics_service" {
  endpoint {
    url = "http://localhost:9090/api/v1/write"

    // Uncomment if authentication is required
    // basic_auth {
    //   username = "your_username"
    //   password = "your_password"
    // }
  }
}

// =============================================================================
// LOGS COLLECTION
// =============================================================================

// Collect systemd journal logs
loki.source.journal "system_logs" {
  // Only collect logs from the last 24 hours
  max_age       = "24h0m0s"
  // Apply relabeling rules to the logs
  relabel_rules = discovery.relabel.log_collection_journal_scrape.rules
  forward_to = [loki.write.logs_service.receiver]
}

// Define relabeling rules for systemd journal logs
discovery.relabel "log_collection_journal_scrape" {
  targets = []

  rule {
    // Extract systemd unit information into a label
    source_labels = ["__journal__systemd_unit"]
    target_label  = "unit"
  }

  rule {
    // Extract boot ID information into a label
    source_labels = ["__journal__boot_id"]
    target_label  = "boot_id"
  }

  rule {
    // Extract transport information into a label
    source_labels = ["__journal__transport"]
    target_label  = "transport"
  }

  rule {
    // Extract log priority into a level label
    source_labels = ["__journal_priority_keyword"]
    target_label  = "level"
  }

  rule {
    // Set the instance label to the hostname of the machine
    target_label = "instance"
    replacement  = constants.hostname
  }

  rule {
    // Set a standard job name for all node_exporter metrics
    target_label = "job"
    replacement = "integrations/systemd_journal"
  }
}

// Collect logs from files (optional)
local.file_match "var_logs" {
  path_targets = [
    {
    // Target localhost for log collection
    __address__ = "localhost",
    // Collect all .log files
    __path__    = "/var/log/**/*.log",
    // Add instance label with hostname
    instance    = constants.hostname,
    // Add job label for logs
    job         = "varlogs",
  },
  ]
}

loki.source.file "var_logs" {
  targets = local.file_match.var_logs.targets
  forward_to = [loki.write.logs_service.receiver]
}


// Send logs to Loki
loki.write "logs_service" {
  endpoint {
    url = "http://localhost:3100/loki/api/v1/push"
    // Uncomment if authentication is required
    // basic_auth {
    //   username = "your_username"
    //   password = "your_password"
    // }
  }
}
The main tweaks you will want to make are the url parameters that point to prometheus and loki servers if they are not running on the same system as alloy. Also for app_logs, remove the /var/log/apt/*.log entry if you are not using Debian Linux or a distro with apt logs.
Minimal Configuration (Local Testing)
For testing without external Prometheus/Loki:
logging {
  level  = "info"
  format = "logfmt"
}

// Just collect metrics
prometheus.exporter.unix "localhost" {
}

prometheus.scrape "default" {
  targets    = prometheus.exporter.unix.localhost.targets
  forward_to = [prometheus.remote_write.local.receiver]
}

prometheus.remote_write "local" {
  endpoint {
    url = "http://localhost:9090/api/v1/write"
  }
}
For the minimal config to work, you need to run prometheus on your local system where Alloy is running.
Managing the Service
Edit Configuration
sudo nano /etc/alloy/config.alloyMost systems debian based will have nano text editor installed. I prefer vim but that would need to be installed.
Reload Configuration
Any time the config changes the service needs to be restarted.
sudo systemctl reload alloyRestart Service
sudo systemctl restart alloyView Logs
sudo journalctl -u alloy -fCheck Status
sudo systemctl status alloyAutomating with Ansible
Use Ansible to apply the same installation and configuration steps across multiple Debian hosts. If you are not familiar with Ansible, check out a previous post
- Install Ansible on your control machine (
pip install ansibleor use your package manager). - Ensure the target hosts allow SSH access with sudo privileges. (Hint: configure SSH at ~/.ssh/config to log in via key easily)
- In this playbook example, our Ansible inventory will target a group of hosts tagged
alloy_targets - Place an
alloy.configin afilesdirectory next to your Ansible playbook
Create install-alloy.yml:
---
- name: Install and configure Grafana Alloy on Debian
  hosts: alloy_targets
  become: true
  vars:
    alloy_config_path: /etc/alloy/config.alloy
  tasks:
    - name: Install required packages
      ansible.builtin.apt:
        name: [gpg, wget, curl]
        state: present
        update_cache: true

    - name: Ensure keyring directory exists
      ansible.builtin.file:
        path: /etc/apt/keyrings
        state: directory
        mode: '0755'

    - name: Add Grafana signing key
      ansible.builtin.apt_key:
        url: https://apt.grafana.com/gpg.key
        keyring: /etc/apt/keyrings/grafana.gpg

    - name: Add Grafana repository
      ansible.builtin.apt_repository:
        repo: 'deb [signed-by=/etc/apt/keyrings/grafana.gpg] https://apt.grafana.com stable main'
        filename: grafana

    - name: Install Grafana Alloy
      ansible.builtin.apt:
        name: alloy
        state: present
        update_cache: true

    - name: Deploy Alloy configuration
      ansible.builtin.copy:
        src: files/config.alloy
        dest: '{{ alloy_config_path }}'
        owner: root
        group: root
        mode: '0644'
      notify: Restart alloy

    - name: Ensure Alloy service is enabled and running
      ansible.builtin.service:
        name: alloy
        state: started
        enabled: true

  handlers:
    - name: Restart alloy
      ansible.builtin.service:
        name: alloy
        state: restarted
Place your Alloy configuration example in files/config.alloy (or convert it to a Jinja2 template) alongside the playbook. Then define an inventory group for the target hosts, for example:
[alloy_targets]
debian-host-1 ansible_host=203.0.113.10
debian-host-2 ansible_host=203.0.113.11
Run the playbook:
ansible-playbook -i inventory.ini install-alloy.yml --becomeAccessing the Alloy UI
Regardless of installation method, once Alloy is up and running with your desired config, the UI should be accessible to test your setup is working.
By default, Alloy listens on 127.0.0.1:12345. To access it:
-
Local access: Navigate to
http://localhost:12345 -
Remote access: Edit
/etc/default/alloyand add:CUSTOM_ARGS="--server.http.listen-addr=0.0.0.0:12345"Then restart:
sudo systemctl restart alloy
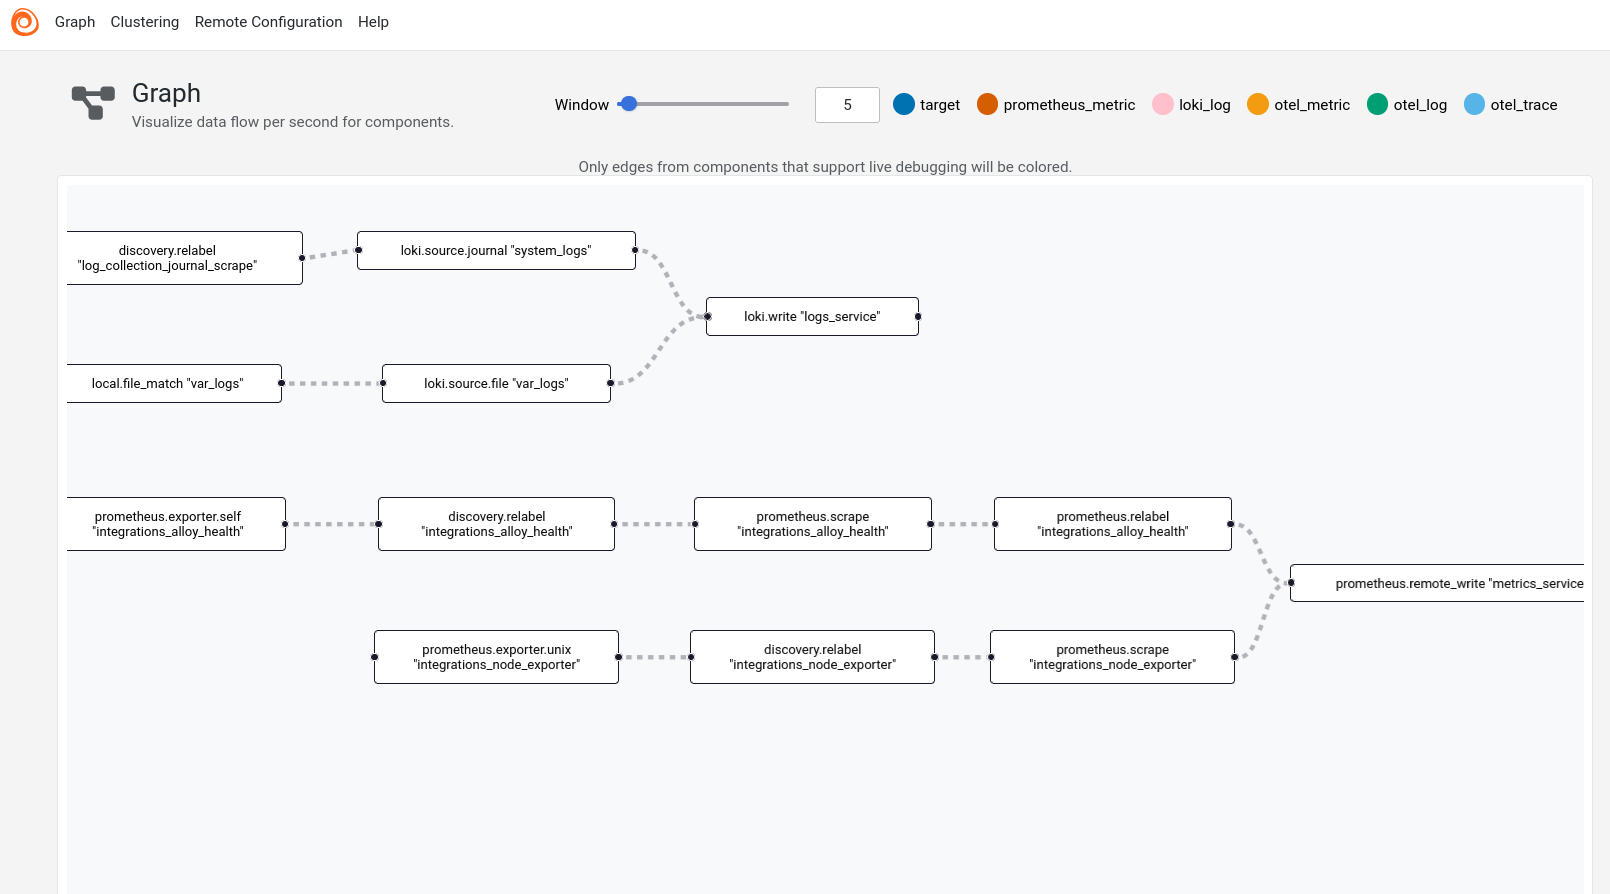
The UI shows:
- Component health status
- Visual pipeline representation
- Live debugging capabilities
- Component exports and metrics
Configuration Tips
Environment Variables
The Alloy environment file lives at /etc/default/alloy. By default Alloy loads /etc/alloy/config.alloy, but you can override that path with CONFIG_FILE.
# Custom config file location
CONFIG_FILE="/path/to/your/config.alloy"

# Additional command-line arguments
CUSTOM_ARGS="--server.http.listen-addr=0.0.0.0:12345"
Common Components
- prometheus.exporter.unix - Collects system metrics (CPU, memory, disk, network)
- loki.source.journal - Collects systemd journal logs
- loki.source.file - Collects logs from files
- prometheus.scrape - Scrapes Prometheus metrics
- prometheus.remote_write - Sends metrics to Prometheus
- loki.write - Sends logs to Loki
- discovery.relabel - Adds/modifies labels
Pipeline Concepts
- Discovery/Collection - Find and collect data (exporters, file_match)
- Processing - Transform, filter, or label data (relabel, process)
- Export - Send data to destinations (remote_write, write)
Components connect via their exports and receivers:
forward_to = [next_component.receiver]Verification
Check Alloy is Running
sudo systemctl status alloy
curl http://localhost:12345/metrics
View in Grafana
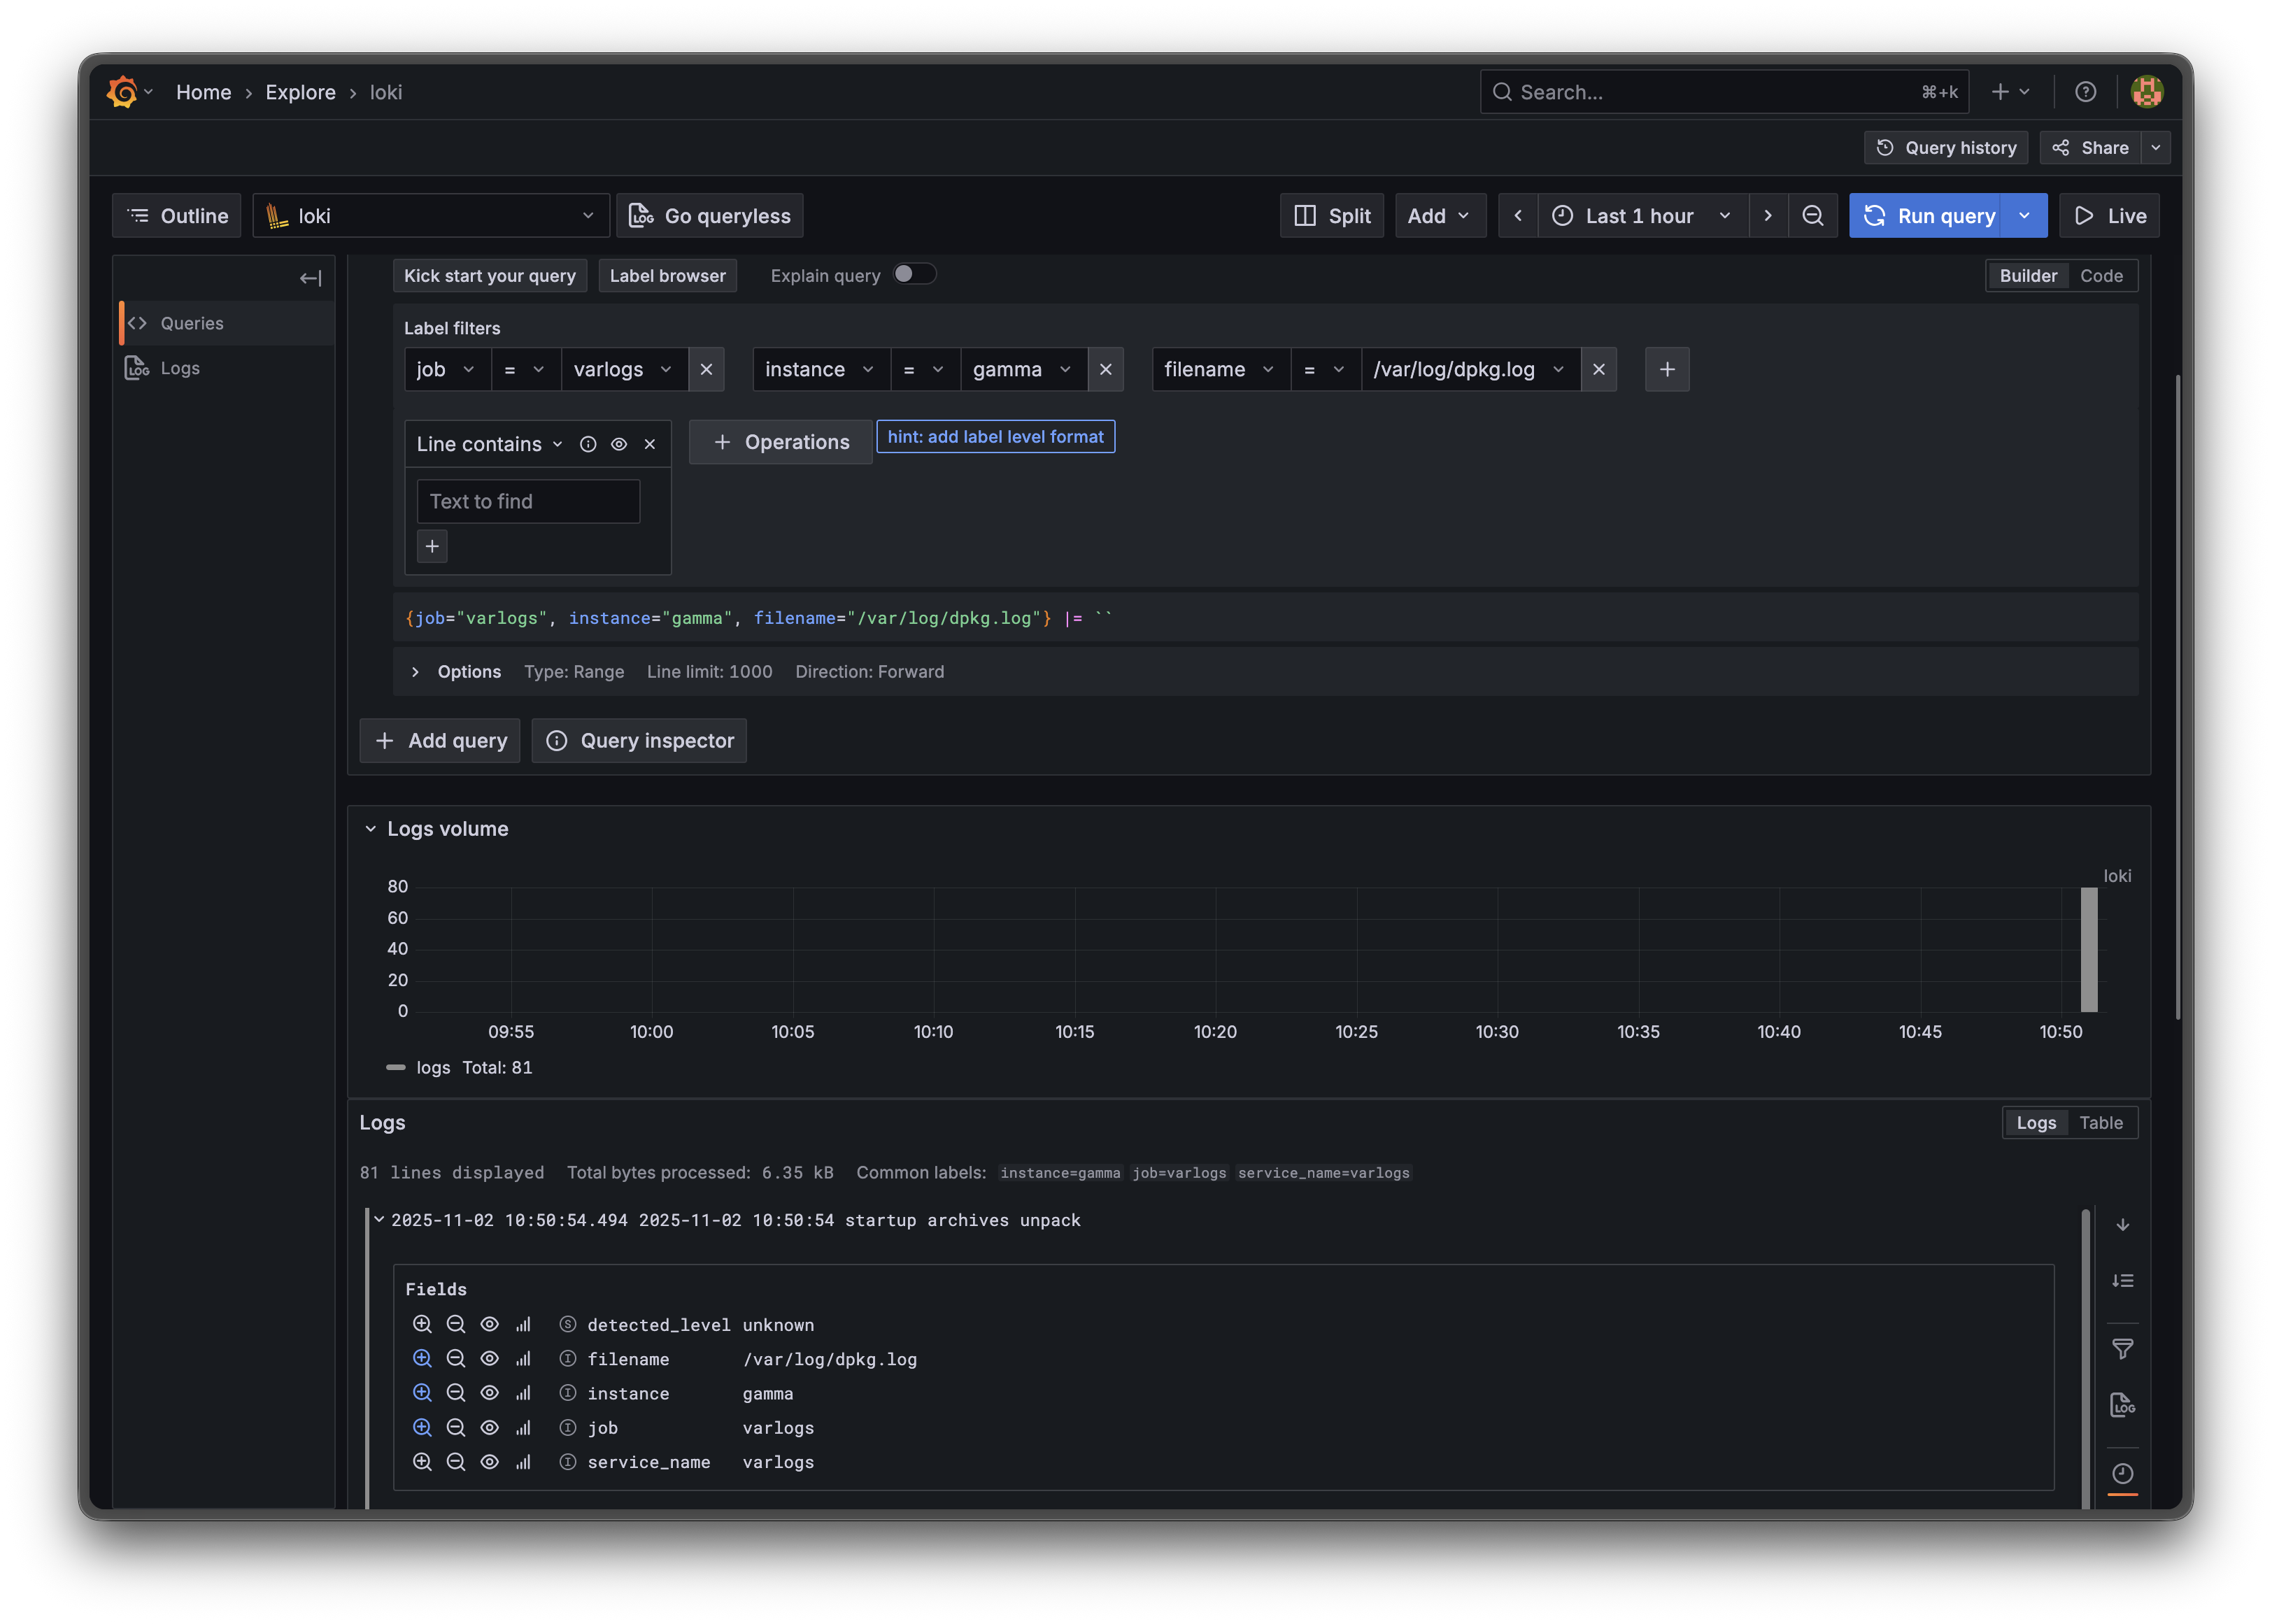
If you have Grafana set up (I think my old post about Grafana Loki can help you get started installing both Grafana and Loki):
- Add Prometheus data source pointing to your Prometheus instance
- Add Loki data source pointing to your Loki instance
- Explore metrics and logs in the Explore view
Troubleshooting
Service won’t start
# Check logs
sudo journalctl -u alloy

# Validate configuration syntax
sudo alloy fmt /etc/alloy/config.alloy
No metrics/logs appearing
- Check component health in UI at
http://localhost:12345 - Verify endpoints are reachable (Prometheus/Loki URLs)
- Check authentication credentials
- Review Alloy logs for errors
Port already in use
Change the listening port:
sudo nano /etc/default/alloy
# Add: CUSTOM_ARGS="--server.http.listen-addr=0.0.0.0:12346"
sudo systemctl restart alloy
Next Steps
- Explore the Alloy component reference for all available components
- Set up custom metric relabeling rules
- Configure log parsing and extraction
- Add application-specific metrics exporters
There is a great public GitHub repo from Grafana labs that show various examples of how to monitor systems with Alloy: https://github.com/grafana/alloy-scenarios/. I used that as a start but I still had to make some tweaks to get the metrics and logs I wanted with the proper labels.
This repository contains scenarios that demonstrate how to use Grafana Alloy to monitor various data sources.
Uninstallation
# Stop service
sudo systemctl stop alloy

# Uninstall
sudo apt-get remove -y alloy

# Remove repository (optional)
sudo rm /etc/apt/sources.list.d/grafana.list
sudo rm /etc/apt/keyrings/grafana.gpg
New disclaimer I am adding: I used an LLM to help create this post but afterwards I spent more than an hour editing it to the final form. This one in particular took a while to tweak the Alloy config