Store metrics with Grafana Mimir
Grafana Mimir is a powerful, horizontally scalable, multi-tenant long-term store for Prometheus metrics. In this post, we’ll spin up a lean, monolithic Mimir stack with Docker Compose. We’ll use local filesystem storage for quick experiments, plus Prometheus for scraping and Grafana Alloy for collecting and forwarding telemetry. I have used this project to store metrics from over 6 different Kubernetes Clusters in one central data repository (Mimir in this case).
What is Grafana Mimir?
Grafana Mimir is an open source software project that provides horizontally scalable, highly available, multi-tenant, long-term storage for Prometheus and OpenTelemetry metrics. It enables users to run queries, create recording rules, and set up alerting rules across multiple tenants. Think of it as Prometheus but with better support for querying historical data using a single data source in Grafana. If you are not familiar with Prometheus, check out a previous post with a brief overview.
Prerequisites
Before we begin, make sure you have the following installed on your system:
- Docker
- Docker Compose
- Basic understanding of Prometheus and metrics collection
- At least 4GB of available RAM for comfortable operation
If you are not familiar with Docker, check out a previous post to get started.
Understanding the Architecture
Our Docker Compose stack will consist of three core components (plus optional Grafana later):
- Grafana Mimir (monolithic) - Time-series database and metrics storage backend using local filesystem blocks
- Prometheus - Metrics scraper that will write to Mimir
- Grafana Alloy - Modern telemetry collector for gathering and forwarding metrics
In this example I will be using another Grafana project, Grafana Alloy, to gather metrics from the local system and send them to Mimir. If you are not familiar with the Alloy project, check out a previous post where I set it up to monitor both metrics and logs for a Linux system.
Step 1: Create the Project Structure
Let’s start by creating a directory structure for this project:
mkdir grafana-mimir-stack
cd grafana-mimir-stack
mkdir -p config data
The config directory will hold our configuration files, while data will store persistent data volumes.
Step 2: Configure Grafana Mimir
Create a file called config/mimir.yaml with the following configuration:
# Mimir configuration for monolithic mode with local filesystem storage
multitenancy_enabled: false

server:
  http_listen_port: 9009
  grpc_listen_port: 9095
  log_level: info

distributor:
  pool:
    health_check_ingesters: true
  ring:
    kvstore:
      store: memberlist

ingester:
  ring:
    kvstore:
      store: memberlist
    replication_factor: 1
    min_ready_duration: 0s
    final_sleep: 0s

ingester_client:
  grpc_client_config:
    max_recv_msg_size: 104857600
    max_send_msg_size: 104857600

blocks_storage:
  backend: filesystem
  filesystem:
    dir: /data/blocks
  tsdb:
    dir: /data/tsdb
  bucket_store:
    sync_dir: /data/tsdb-sync

compactor:
  data_dir: /data/compactor
  sharding_ring:
    kvstore:
      store: memberlist

store_gateway:
  sharding_ring:
    replication_factor: 1
    kvstore:
      store: memberlist

ruler_storage:
  backend: filesystem
  filesystem:
    dir: /data/rules

limits:
  ingestion_rate: 250000
  ingestion_burst_size: 500000
This configuration keeps Mimir in monolithic mode (all components in one process) and stores blocks on the local filesystem. This is great for labs and demos, but plan on external object storage for production durability.
Step 3: Configure Prometheus
Create config/prometheus.yaml to configure Prometheus to scrape itself and remote write to Mimir:
global:
  scrape_interval: 15s
  evaluation_interval: 15s
  external_labels:
    cluster: 'docker-compose'
    namespace: 'monitoring'

scrape_configs:
  # Scrape Prometheus itself
  - job_name: 'prometheus'
    static_configs:
      - targets: ['localhost:9090']

  # Scrape Mimir metrics
  - job_name: 'mimir'
    static_configs:
      - targets: ['mimir:9009']

  # Scrape Alloy metrics
  - job_name: 'alloy'
    static_configs:
      - targets: ['alloy:12345']

remote_write:
  - url: http://mimir:9009/api/v1/push
    queue_config:
      capacity: 10000
      max_shards: 10
      min_shards: 1
      max_samples_per_send: 5000
      batch_send_deadline: 5s
Step 4: Configure Grafana Alloy
Create config/alloy.yaml for Alloy to collect system metrics and forward them to Mimir:
// Logging configuration
logging {
  level  = "info"
  format = "logfmt"
}

// Prometheus metrics exporter for system metrics
prometheus.exporter.unix "system" {
  // Use default settings to collect CPU, memory, disk, and network metrics
}

// Scrape the unix exporter
prometheus.scrape "local_metrics" {
  targets    = prometheus.exporter.unix.system.targets
  forward_to = [prometheus.remote_write.mimir.receiver]
  scrape_interval = "15s"
}

// Scrape Alloy's own metrics
prometheus.scrape "self_metrics" {
  targets = [{
    __address__ = "localhost:12345",
  }]
  forward_to = [prometheus.remote_write.mimir.receiver]
  scrape_interval = "15s"
}

// Remote write to Mimir
prometheus.remote_write "mimir" {
  endpoint {
    url = "http://mimir:9009/api/v1/push"

    queue_config {
      capacity             = 10000
      max_shards           = 10
      min_shards           = 1
      max_samples_per_send = 5000
      batch_send_deadline  = "5s"
    }
  }
}
This configuration sets up Alloy to:
- Collect system-level metrics using the Unix exporter
- Scrape its own telemetry
- Forward all metrics to Mimir via remote write
Step 5: Create the Docker Compose File
Now, let’s tie everything together with docker-compose.yaml:
networks:
  mimir-net:
    driver: bridge

volumes:
  mimir-data:
  prometheus-data:
  alloy-data:
  grafana-data:

services:
  # Grafana Mimir
  mimir:
    image: grafana/mimir:latest
    container_name: mimir
    networks:
      - mimir-net
    ports:
      - '9009:9009'
      - '9095:9095'
    command:
      - -config.file=/etc/mimir/mimir.yaml
      - -target=all
    volumes:
      - ./config/mimir.yaml:/etc/mimir/mimir.yaml:ro
      - mimir-data:/data
    healthcheck:
      # Mimir image is distroless, so use a self-check instead of shell/curl
      test: ['CMD', '/bin/mimir', '-version']
      interval: 10s
      timeout: 5s
      retries: 5

  # Prometheus
  prometheus:
    image: prom/prometheus:latest
    container_name: prometheus
    networks:
      - mimir-net
    ports:
      - '9090:9090'
    command:
      - --config.file=/etc/prometheus/prometheus.yml
      - --storage.tsdb.path=/prometheus
      - --web.enable-remote-write-receiver
      - --enable-feature=native-histograms
    volumes:
      - ./config/prometheus.yaml:/etc/prometheus/prometheus.yml:ro
      - prometheus-data:/prometheus
    depends_on:
      mimir:
        condition: service_healthy

  # Grafana Alloy
  alloy:
    image: grafana/alloy:latest
    container_name: alloy
    networks:
      - mimir-net
    ports:
      - '12346:12345'
    command:
      - run
      - --server.http.listen-addr=0.0.0.0:12345
      - --storage.path=/var/lib/alloy/data
      - /etc/alloy/config.alloy
    volumes:
      - ./config/alloy.yaml:/etc/alloy/config.alloy:ro
      - alloy-data:/var/lib/alloy/data
      - /proc:/host/proc:ro
      - /sys:/host/sys:ro
      - /:/rootfs:ro
    environment:
      - HOSTNAME=alloy
    depends_on:
      mimir:
        condition: service_healthy
    privileged: true
Step 6: Launch the Stack
With all configuration files in place, it’s time to bring up the stack:
docker compose up -dThis command will:
- Pull all necessary Docker images
- Create the isolated network
- Start Mimir, Prometheus, and Alloy in the correct order
You can monitor the startup progress with:
docker compose logs -fStep 7: Verify the Deployment
Once all services are running, verify each component:
Check Mimir Status
curl http://localhost:9009/readyYou should receive a 200 OK response.
View Mimir Endpoints
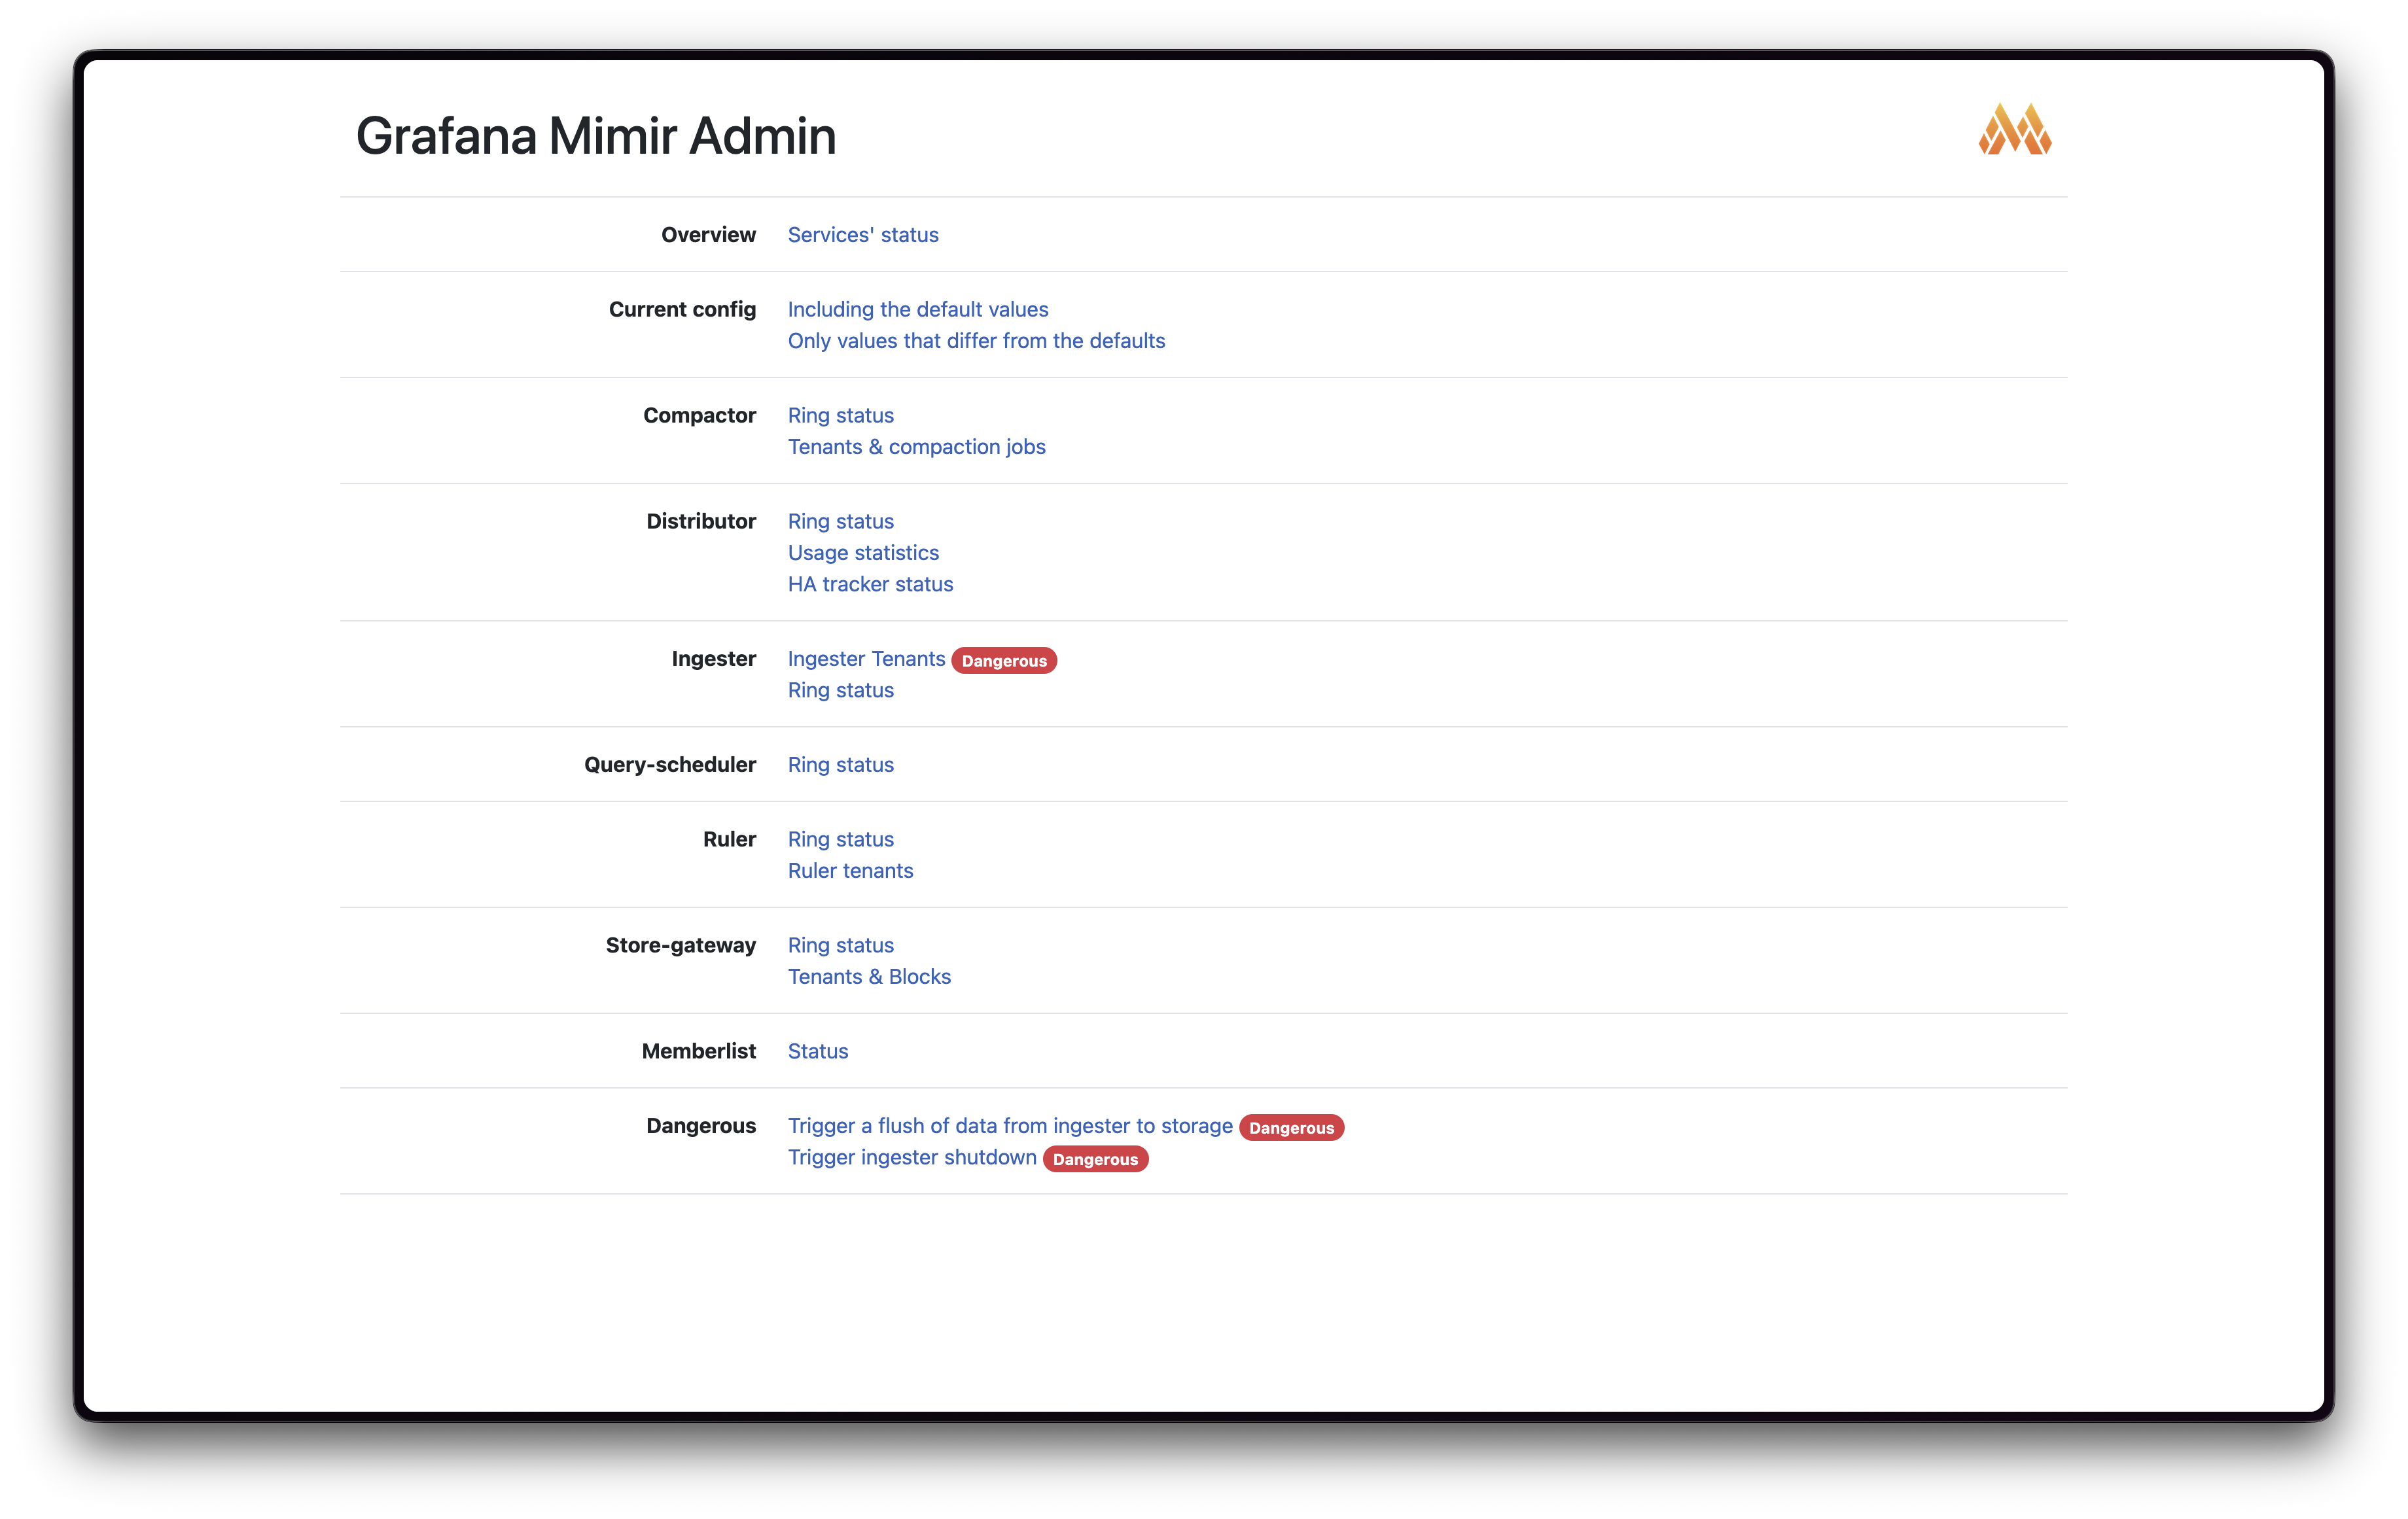
You can view a basic Web UI for Mimir as well as plaintext endpoints for a healthcheck and an endpoint for metrics about the current running Mimir processes:
- UI: http://localhost:9009/
- Readiness: http://localhost:9009/ready (expect
200 OK) - Metrics: http://localhost:9009/metrics (Prometheus exposition format)

Check Prometheus
Visit http://localhost:9090 and try querying:
up{job="mimir"}This should return metrics showing Mimir is being scraped successfully.
Monitor Alloy
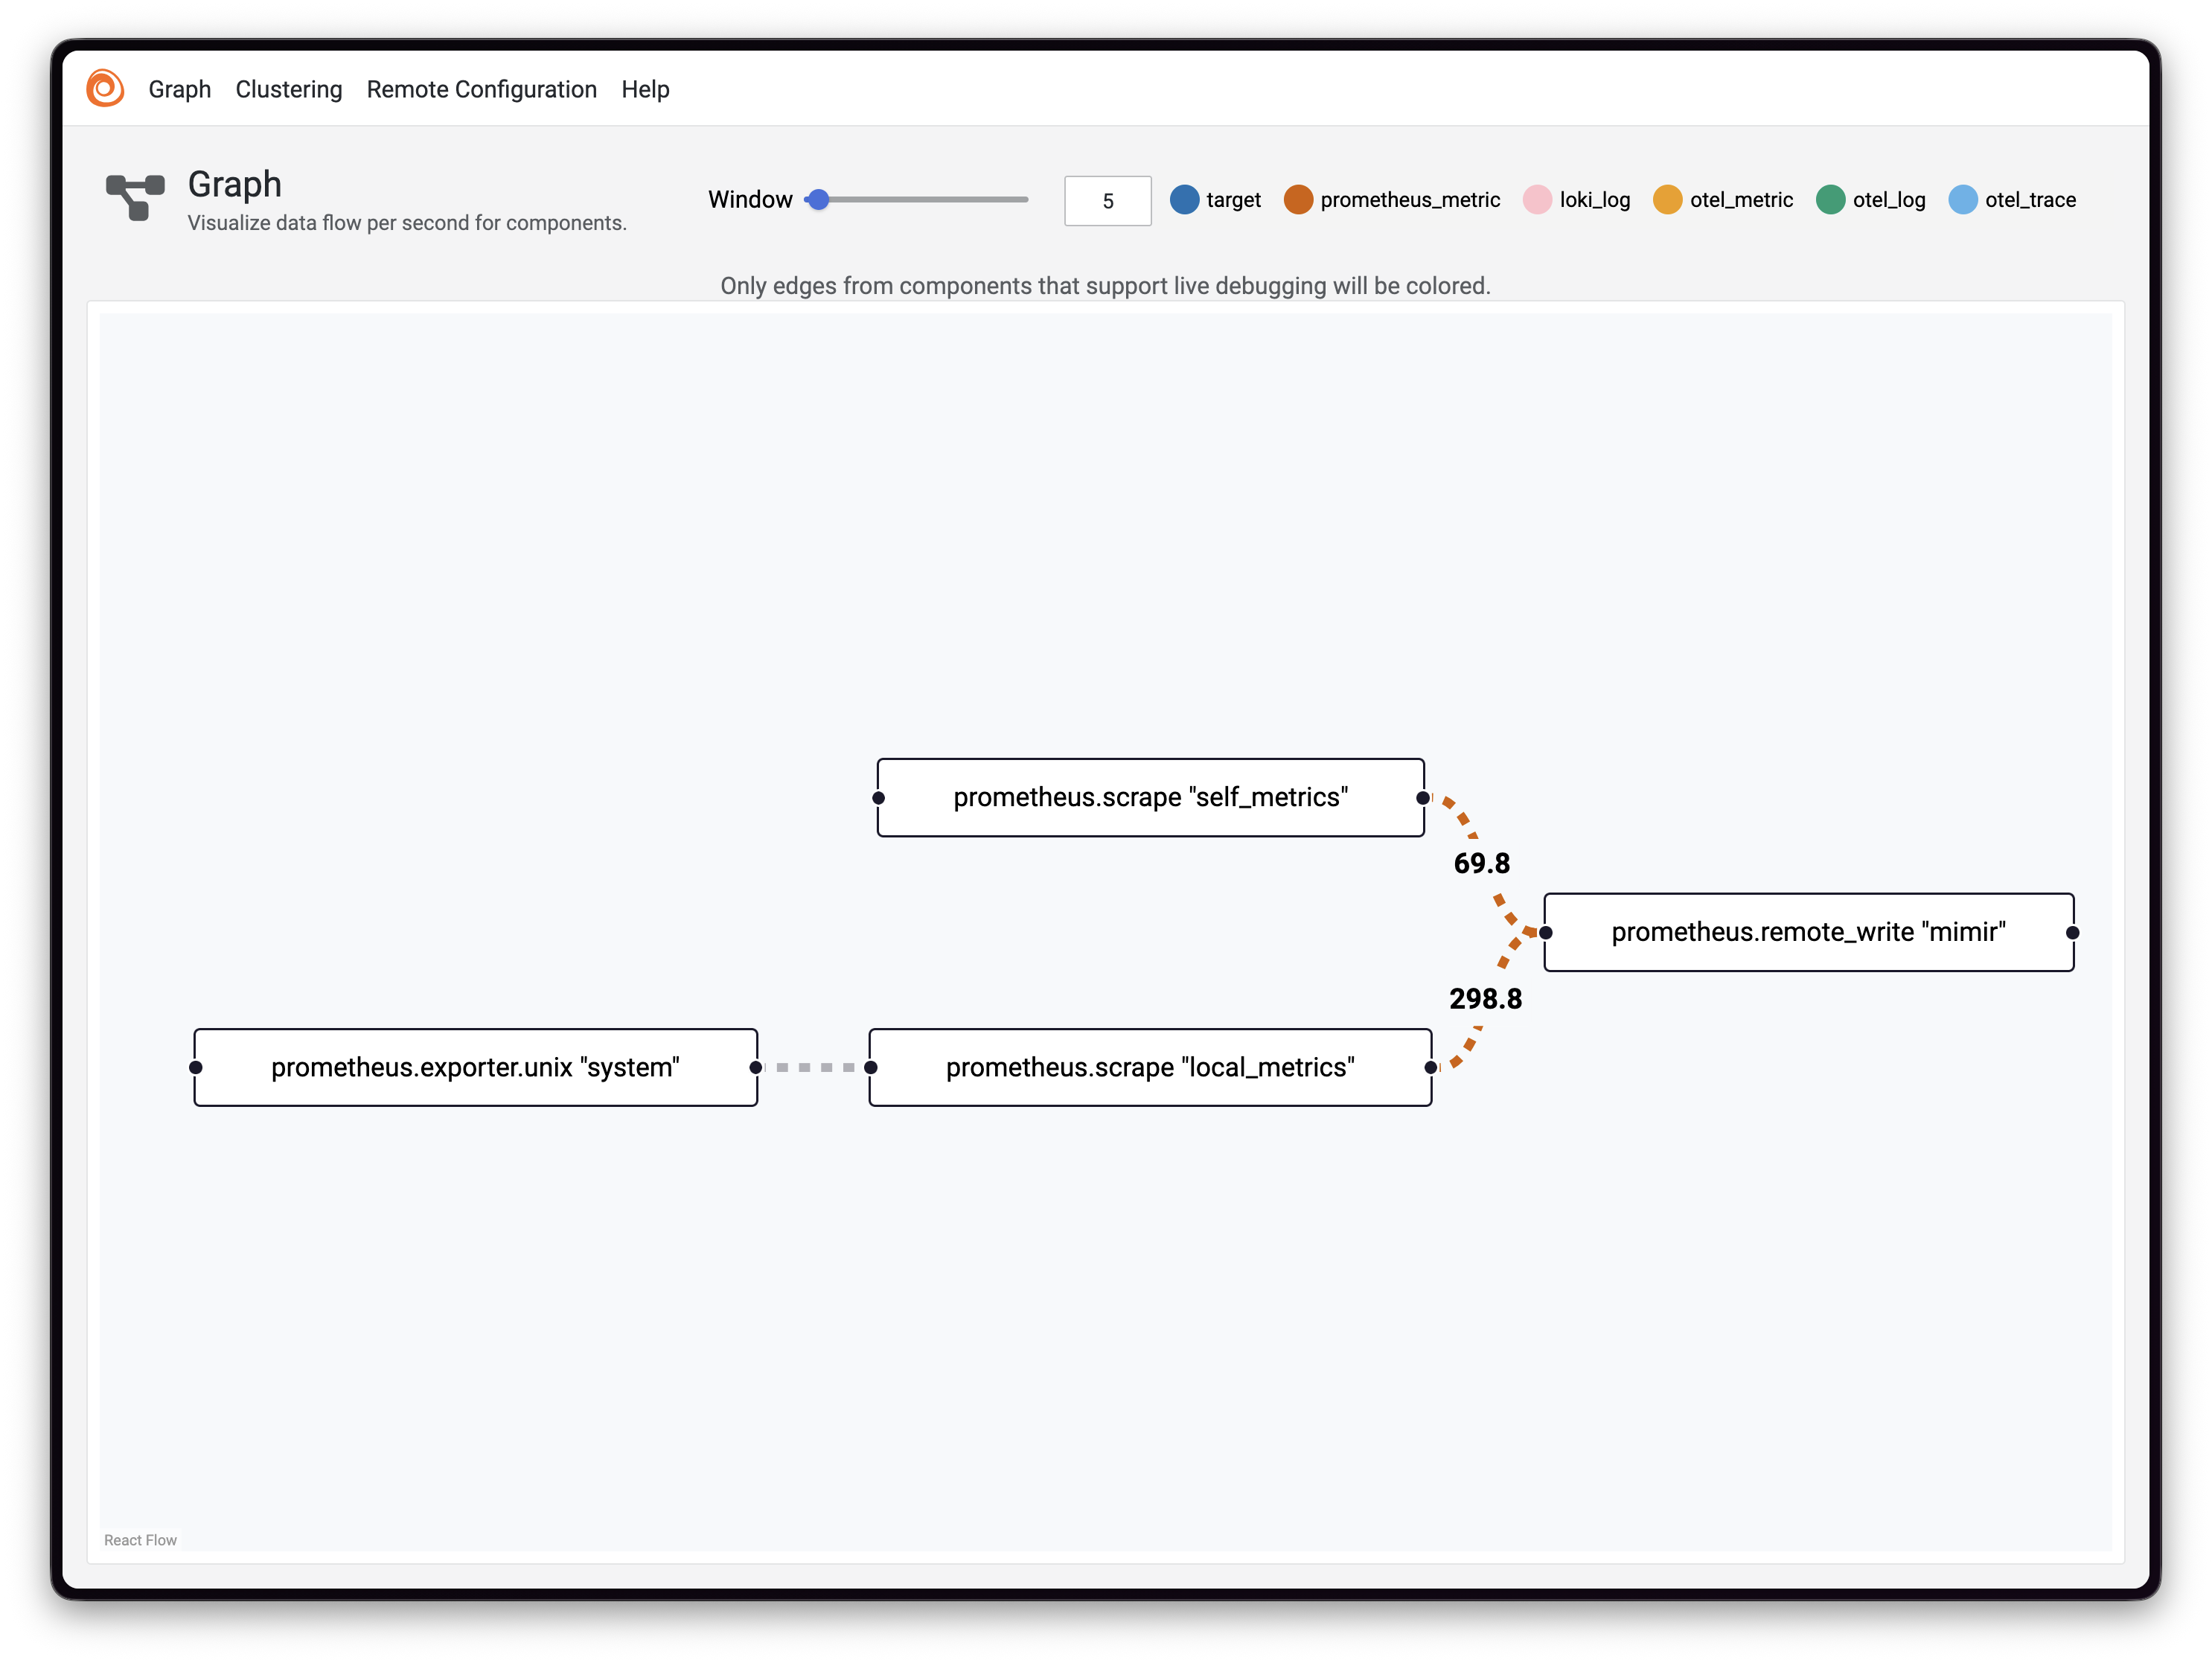
The Alloy UI is available at http://localhost:12346 (host-mapped). Here you can visualize the component pipeline and verify that metrics are flowing correctly.

Step 8: Query Metrics in Grafana
To visualize your metrics, you’ll want to add Grafana to the stack. Add this service to your docker-compose.yaml:
# Grafana
grafana:
  image: grafana/grafana:latest
  container_name: grafana
  networks:
    - mimir-net
  ports:
    - '3000:3000'
  environment:
    - GF_AUTH_ANONYMOUS_ENABLED=true
    - GF_AUTH_ANONYMOUS_ORG_ROLE=Admin
    - GF_SECURITY_ADMIN_PASSWORD=admin
  volumes:
    - grafana-data:/var/lib/grafana
  depends_on:
    - mimir
Restart the stack:
docker compose up -dAccess Grafana at http://localhost:3000 and add Mimir as a data source:
- Navigate to Configuration → Data Sources
- Click Add data source
- Select Prometheus
- Set the URL to:
http://mimir:9009/prometheus - Click Save & Test
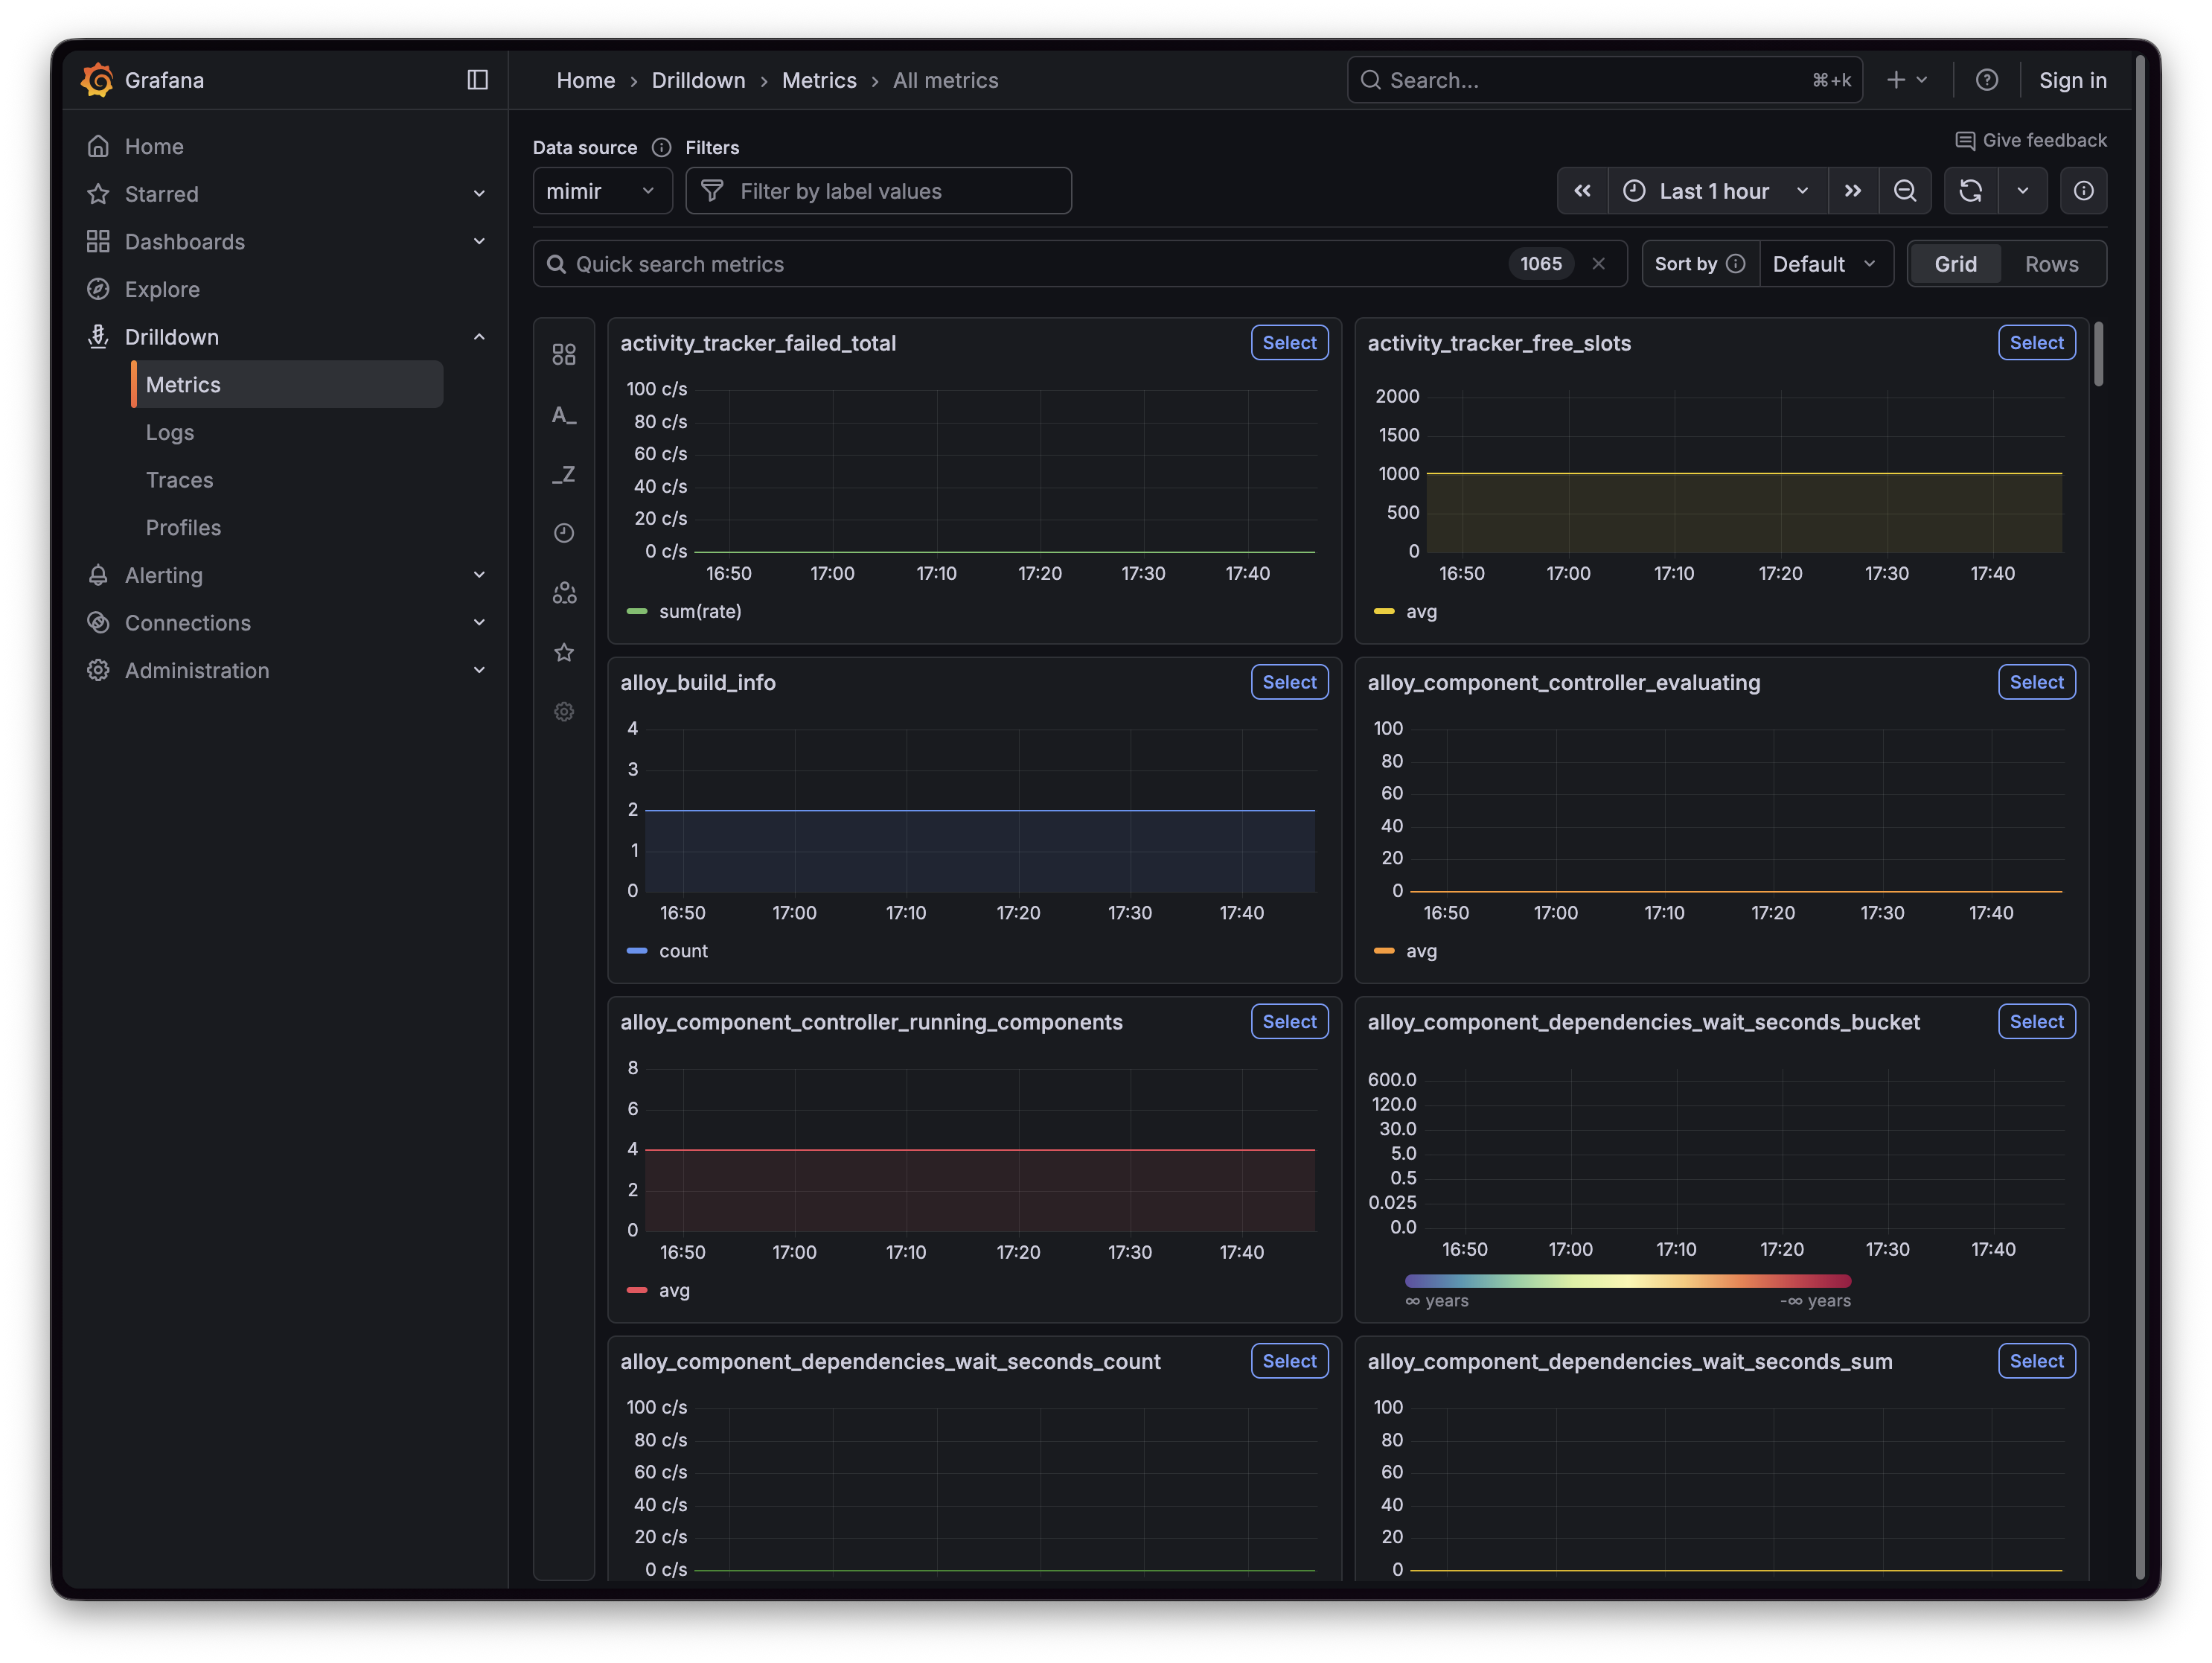
Once added, You should be able to view metrics in Grafana. In newer versions, the Drilldown -> Metrics view shows current metrics for a data source:
Navigate to http://localhost:3000/a/grafana-metricsdrilldown-app/drilldown

Understanding the Metrics Flow
Let’s visualize how metrics flow through our stack:
- Alloy collects system metrics and scrapes its own telemetry
- Alloy forwards these metrics to Mimir via remote write
- Prometheus scrapes metrics from Mimir, Alloy, and itself
- Prometheus forwards all scraped metrics to Mimir via remote write
- Mimir stores metrics as blocks on the local filesystem (backed by the
mimir-datavolume) - Grafana queries Mimir to visualize metrics
Scaling and Production Considerations
While this docker stack is great for getting started, production deployments usually use object storage and separate Mimir into microservices so reads and writes can scale independently. Consider:
High Availability
Deploy multiple Mimir instances with a load balancer:
mimir-1:
  image: grafana/mimir:latest
  # ... configuration

mimir-2:
  image: grafana/mimir:latest
  # ... configuration

mimir-3:
  image: grafana/mimir:latest
  # ... configuration

load-balancer:
  image: nginx:latest
  # ... nginx configuration for load balancing
Microservices Mode
For larger deployments, run Mimir components separately (ingester, distributor, querier, etc.) to scale them independently based on your workload. I use Mimir in my job for over 12 Million metric series and our production deployment has dozens of individual pods (containers) to run each component. Metrics are persisted to s3 object storage and when you query Mimir in Grafana, it appears to be as simple as querying a single Prometheus server but on the backend, a service is looking up the data stored in s3.
External Object Storage
Switch from local filesystem blocks to object storage such as cloud providers:
- AWS S3
- Google Cloud Storage
- Azure Blob Storage
Resource Limits
Add resource constraints to prevent any single container from consuming all host resources. If using Kubernetes, set resource requests and limits.
Troubleshooting Common Issues
Mimir Won’t Start
Problem: Mimir fails with “failed to create bucket store” or cannot write to directories.
Solution: Verify the mimir-data volume is mounted and writable (filesystem backend):
docker compose logs mimirNo Metrics Flowing
Problem: Queries return no data
Solution: Check remote write configuration and network connectivity:
# Check Prometheus targets
curl http://localhost:9090/api/v1/targets

# Check Mimir ingestion
curl http://localhost:9009/api/v1/status/buildinfo
High Memory Usage
Problem: Containers consuming too much memory
Solution: Adjust the limits in config/mimir.yaml:
limits:
  ingestion_rate: 100000 # Reduce from 250000
  ingestion_burst_size: 200000 # Reduce from 500000
  max_global_series_per_user: 500000
Monitoring Your Monitoring Stack
Ironically, you’ll want to monitor your monitoring infrastructure. Create a dashboard in Grafana with these key metrics:
# Mimir ingestion rate
sum(rate(cortex_distributor_received_samples_total[5m]))

# Active series
sum(cortex_ingester_active_series)

# Query performance (frontend -> querier path)
histogram_quantile(0.99, sum(rate(cortex_querier_query_frontend_request_duration_seconds_bucket[5m])) by (le))

# Alloy metrics forwarded (and Prometheus -> Mimir)
rate(prometheus_remote_storage_samples_total[5m])
In a production environment, you should consider running a separate monitoring system to gather metrics about your monitoring stack, a “watcher of watchers”.
Clean Up
When you’re done experimenting, clean up all resources:
# Stop all containers
docker compose down

# Remove volumes (WARNING: This deletes all data)
docker compose down -v

# Remove everything including networks
docker compose down -v --remove-orphans
Next Steps
You now have a fully functional Grafana Mimir stack running with Docker Compose. This setup provides a solid foundation for metrics storage and analysis. Mimir enables you to run queries that aggregate series from multiple Prometheus instances, giving you a global view of your systems, while using cost-effective object storage for long-term data retention.
From here, you can:
- Add more Prometheus instances to scrape different targets
- Deploy additional Alloy instances across your infrastructure
- Create sophisticated dashboards in Grafana
- Set up alerting rules in Mimir
- Experiment with Mimir’s query sharding and caching features
The utility of this Docker Compose approach is that you can iterate quickly, test configurations, and learn Mimir’s capabilities before committing to a production deployment.
Additional Resources
- Grafana Mimir Documentation
- Grafana Alloy Documentation
- Prometheus Remote Write Specification
- Mimir GitHub Repository
New disclaimer I am adding: I used an LLM to help create this post but afterwards I spent more than an hour editing it to the final form.