Prometheus run on Kubernetes
On Kubernetes, you can run a Prometheus server by installing a Helm chart. If you are looking for information about what to do with Prometheus, check out a previous post to get an overview. This chart is maintained by the community and is available to browse on GitHub. There are a lot of options that can be configured with a values YAML file. This chart can also optionally install some other software such as Grafana, a node metrics exporter, and the kube state metrics server.
Backing up a bit, Kubernetes is an open source API/platform for managing container based workloads. Check out a previous post if you would like to learn more about what Kubernetes is.
Install kube-prometheus-stack
Prerequisites
- A Kubernetes cluster, probably at least v1.28 but older releases will work.
- Helm 3 installed on a system where you can download the community helm chart.
Prepare the helm chart
helm repo add prometheus-community https://prometheus-community.github.io/helm-charts
helm repo update
helm search repo prometheus-stack
This should show the latest release of the prometheus stack:
NAME                                              	CHART VERSION	APP VERSION	DESCRIPTION
prometheus-community/kube-prometheus-stack        	66.3.1       	v0.78.2    	kube-prometheus-stack collects Kubernetes manif...
prometheus-community/prometheus-stackdriver-exp...	4.6.2        	v0.16.0    	Stackdriver exporter for Prometheus
Now the chart can be installed with all defaults or you can customize with a values file or supply values with the command line.
To install the chart with all default options and create a namespace monitoring if it does not already exist.
helm install kube-prometheus-stack \
  prometheus-community/kube-prometheus-stack \
  --create-namespace -n monitoring
Configure prometheus
You can configure this Prometheus server by adjusting the Helm chart.
For example, here are the values that I supply to the helm chart for my cluster:
fullnameOverride: prometheus
prometheus:
  prometheusSpec:
    additionalScrapeConfigs:
      # This is a proxmox prometheus exporter that I am scraping
      # using this prometheus server
      - job_name: 'proxmox'
        static_configs:
          - targets:
              - proxmox.example.com
        metrics_path: /pve
        params:
          module: [default]
        relabel_configs:
          - source_labels: [__address__]
            target_label: __param_target
          - source_labels: [__param_target]
            target_label: instance
          - target_label: __address__
            replacement: pve-exporter.monitoring.svc.cluster.local:9221
    retention: 2d
    remoteWrite:
      # This configures the prometheus container to write all
      # metrics to a remote server endpoint
      # in my case this is another promtheus server on another system
      - url: https://server.example.net/api/v1/write
    serviceMonitorSelectorNilUsesHelmValues: false
    storageSpec:
      # At one point I tried to use nfs storage
      # for prometheus. You can uncomment this
      # if you have nfs or change the storageClass
      # to something on your cluster
      # Otherwise, prometheus will use an emptyDir volume
      # since I remote write metrics I do not care about the
      # durability of the prometheus storage inside k8s
      # volumeClaimTemplate:
      #   spec:
      #     storageClassName: nfs-client
      #     resources:
      #       requests:
      #         storage: 40Gi
grafana:
  defaultDashboardsTimezone: 'America/Chicago'
  grafana.ini:
    feature_toggles:
      enable: tempoSearch
  ingress:
    enabled: true
    hosts:
      - grafana.example.com
    tls:
      - secretName: tls-lan
        hosts:
          - grafana.example.com
  persistence:
    type: statefulset
    enabled: sts
    size: 2Gi
    storageClassName: openebs-hostpath # Requires openebs
  datasources:
    datasources.yaml:
      apiVersion: 1
      datasources:
        - name: Loki
          type: loki
          uid: Loki
          access: proxy
          editable: false
          url: http://loki.monitoring:3100 # requies loki installed in cluster
          jsonData:
            # To setup integration between Loki and Tempo
            derivedFields:
              - datasourceUid: Tempo
                matcherRegex: "(?:traceID|traceId)(?:=|\\s)(\\w+)"
                name: TraceID
                url: '$${__value.raw}'
        - name: Tempo
          type: tempo
          uid: Tempo
          access: proxy
          editable: false
          url: http://tempo-gateway.monitoring:80 # requires tempo installed in cluster
  sidecar:
    dashboards:
      enabled: true
      label: grafana_dashboard
      folder: /tmp/dashboards
      searchNamespace: ALL
There is a lot to unpack here but all of this set up here is a result of other software I have in my homelab. Previously I have set up Grafana Loki for aggregating logs, Grafana Tempo for collecting traces from applications, and I have set up Prometheus and Grafana to run outside of Kubernetes. Check out those linked posts for more background on those projects.
Install with argoCD
I use argoCD to deploy helm charts in my cluster and the config files are stored in a git repository. My argoCD application spec is the values file above along with a few options for argoCD. Here is an example argoCD application custom resource that I deploy:
---
apiVersion: argoproj.io/v1alpha1
kind: Application
metadata:
  name: prometheus
  namespace: argocd
spec:
  destination:
    namespace: monitoring
    server: https://kubernetes.default.svc
  project: default
  source:
    chart: kube-prometheus-stack
    repoURL: https://prometheus-community.github.io/helm-charts
    targetRevision: 61.3.1
    helm:
      values: |
        fullnameOverride: prometheus
        prometheus:
          prometheusSpec:
            additionalScrapeConfigs:
              # This is a proxmox prometheus exporter that I am scraping
              # using this prometheus server
              - job_name: "proxmox"
                static_configs:
                  - targets:
                      - proxmox.example.com
                metrics_path: /pve
                params:
                  module: [default]
                relabel_configs:
                  - source_labels: [__address__]
                    target_label: __param_target
                  - source_labels: [__param_target]
                    target_label: instance
                  - target_label: __address__
                    replacement: pve-exporter.monitoring.svc.cluster.local:9221
            retention: 2d
            remoteWrite:
              # This configures the prometheus container to write all
              # metrics to a remote server endpoint
              # in my case this is another promtheus server on another system
              - url: https://server.example.net/api/v1/write
            serviceMonitorSelectorNilUsesHelmValues: false
            storageSpec:
              # At one point I tried to use nfs storage
              # for prometheus. You can uncomment this
              # if you have nfs or change the storageClass
              # to something on your cluster
              # Otherwise, prometheus will use an emptyDir volume
              # since I remote write metrics I do not care about the
              # durability of the prometheus storage inside k8s
              # volumeClaimTemplate:
              #   spec:
              #     storageClassName: nfs-client
              #     resources:
              #       requests:
              #         storage: 40Gi
        grafana:
          defaultDashboardsTimezone: "America/Chicago"
          grafana.ini:
            feature_toggles:
              enable: tempoSearch
          ingress:
            enabled: true
            hosts:
              - grafana.example.com
            tls:
              - secretName: tls-lan
                hosts:
                  - grafana.example.com
          persistence:
            type: statefulset
            enabled: sts
            size: 2Gi
            storageClassName: openebs-hostpath # Requires openebs
          datasources:
            datasources.yaml:
              apiVersion: 1
              datasources:
                - name: Loki
                  type: loki
                  uid: Loki
                  access: proxy
                  editable: false
                  url: http://loki.monitoring:3100 # requies loki installed in cluster
                  jsonData:
                    # To setup integration between Loki and Tempo
                    derivedFields:
                      - datasourceUid: Tempo
                        matcherRegex: "(?:traceID|traceId)(?:=|\\s)(\\w+)"
                        name: TraceID
                        url: "$${__value.raw}"
                - name: Tempo
                  type: tempo
                  uid: Tempo
                  access: proxy
                  editable: false
                  url: http://tempo-gateway.monitoring:80 # requires tempo installed in cluster
          sidecar:
            dashboards:
              enabled: true
              label: grafana_dashboard
              folder: /tmp/dashboards
              searchNamespace: ALL
  # end of values
  syncPolicy:
    automated:
      prune: true
      selfHeal: true
    syncOptions:
      - CreateNamespace=true
      - ServerSideApply=true
To install the helm chart with argoCD, I apply the above manifest to the cluster:
kubectl apply -f application.yamlUsing prometheus
You can use prometheus to collect many different types of metrics. Check out a previous post about prometheus and how to create graphs based on metrics collected using Grafana. After installing the helm chart, the Grafana server running inside the cluster will have some dashboards with Kubernetes metrics already populated. If you have used Prometheus elsewhere to collect system metrics with the node exporter, now Kubernetes nodes should also now have metrics available from the node exporter.
In my helm values, I supplied a configuration for an Ingress for Grafana. An ingress will create a load balancer or reverse proxy type configuration depending on your cluster to expose the Grafana server. You will need a DNS record that points to the hostname you provided in the ingress configuration. The other option is to use the kubectl utility to create a proxy from the Grafana service inside the k8s cluster to your local machine.
kubectl port-forward -n monitoring svc/prometheus-grafana 8080:80Unless you configure a password using the values file, the default credentials for this Grafana server will be username: admin, password: prom-operator
The server should prompt you to change the password when you first log in. Navigate to the Dashboards tab in the menu and you should see many Kubernetes dashboards.
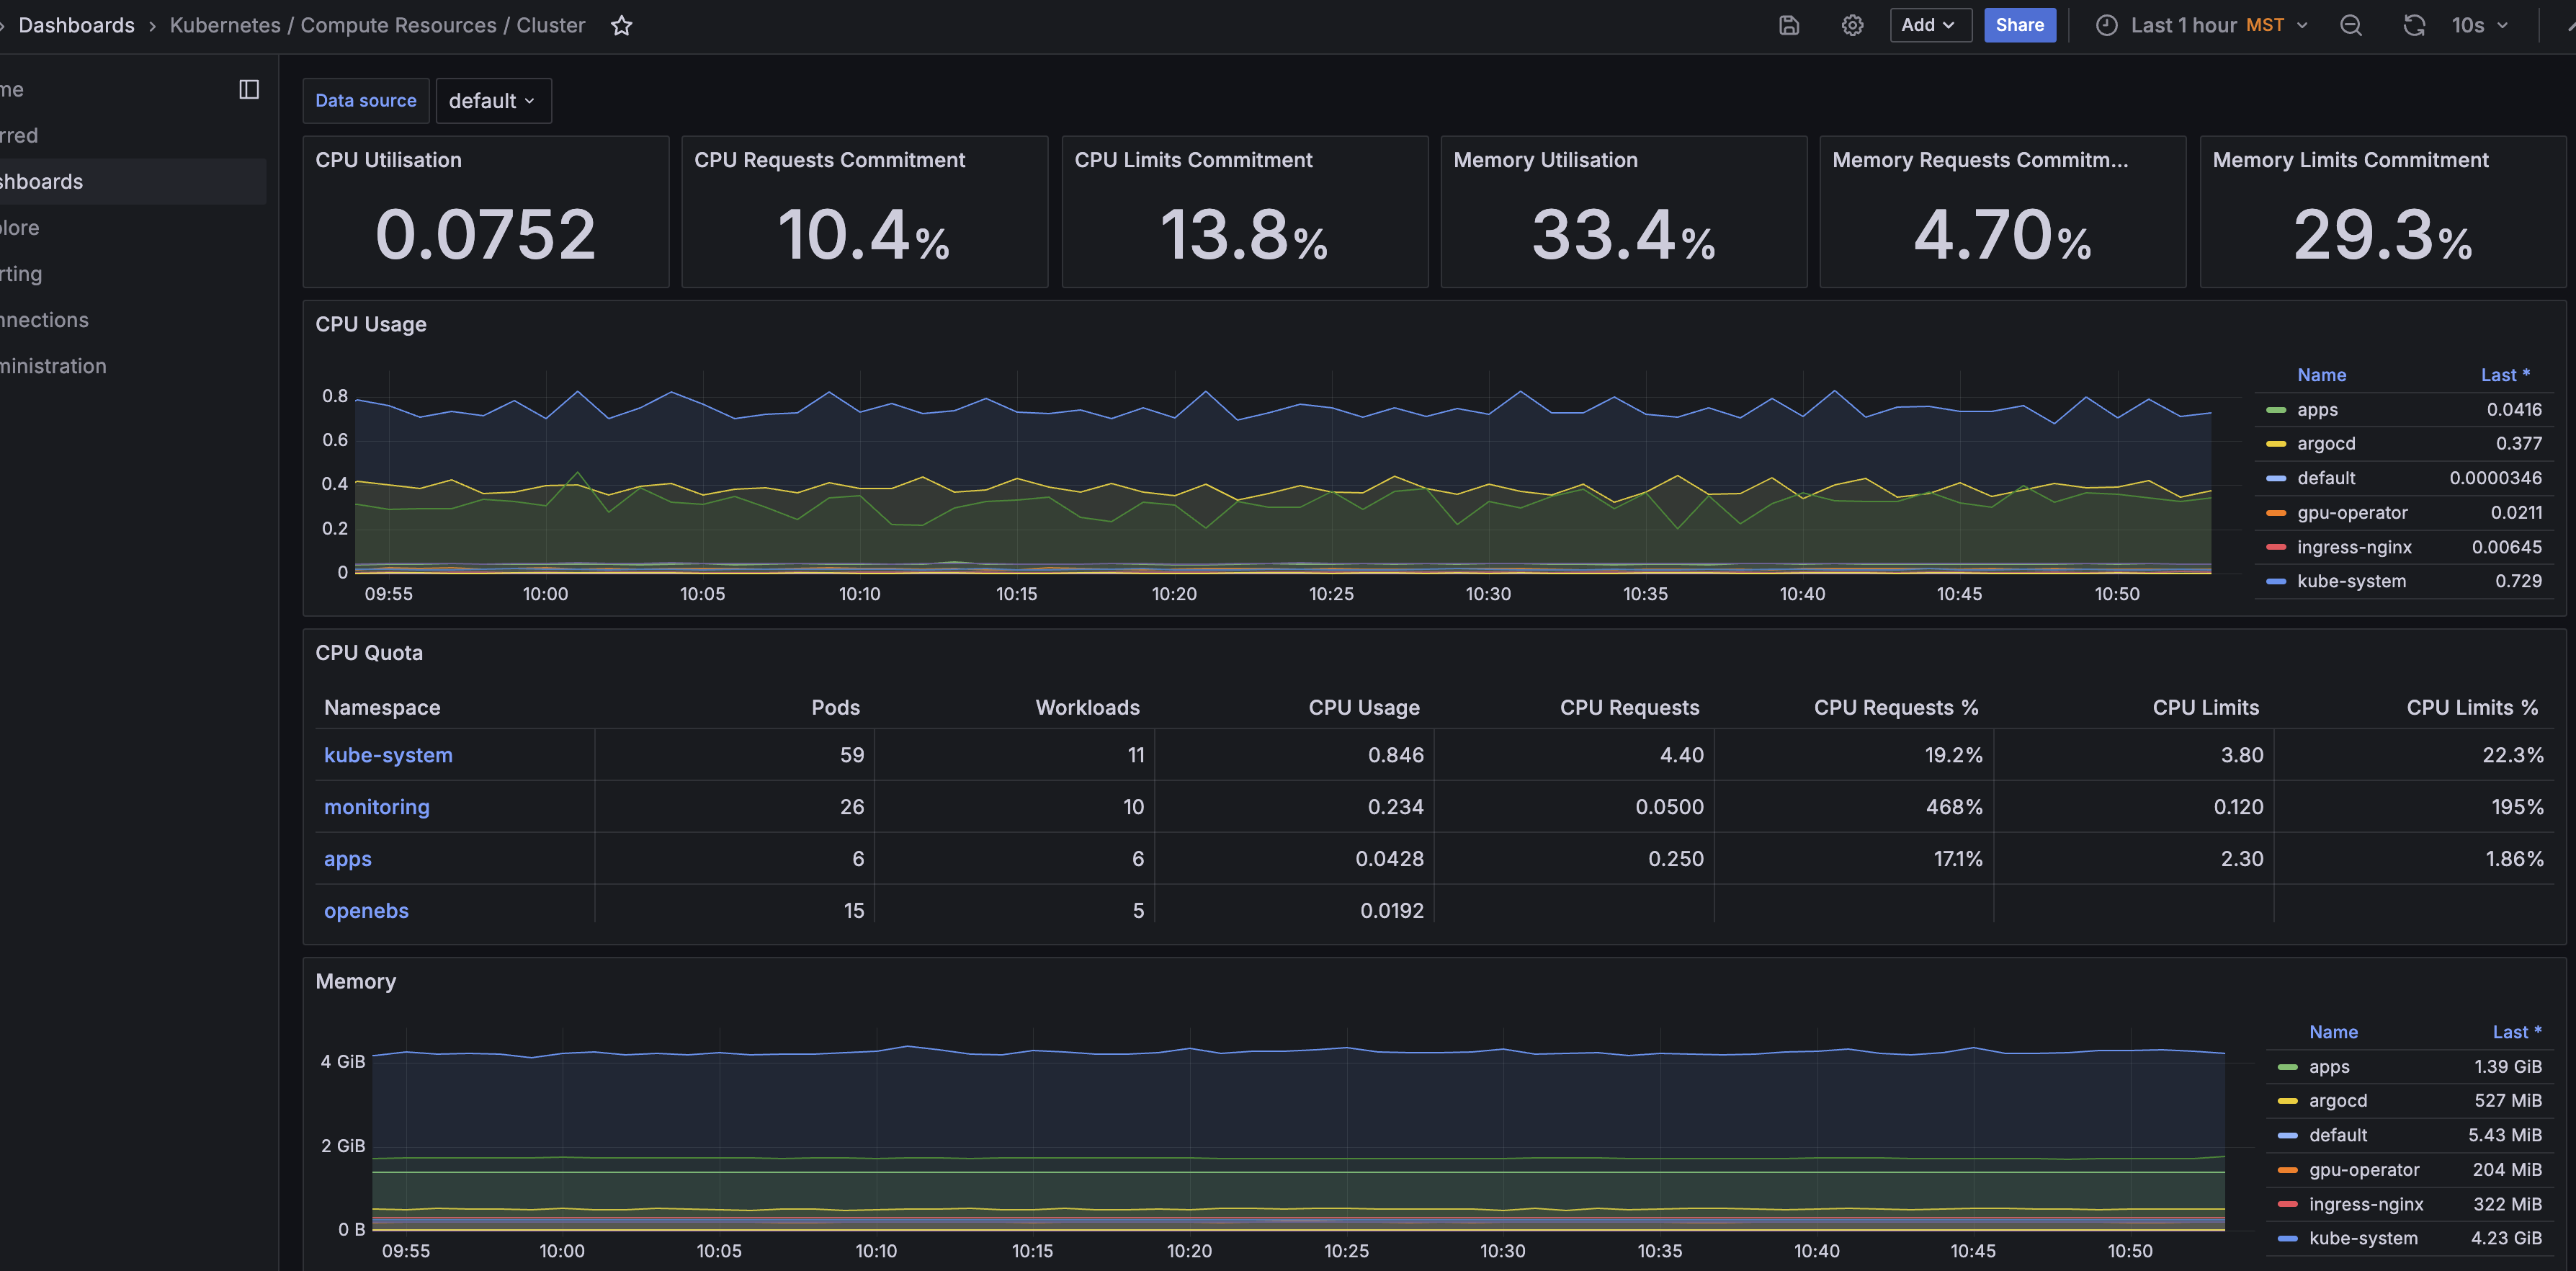
Here is an overview dashboard for compute resources in the cluster:

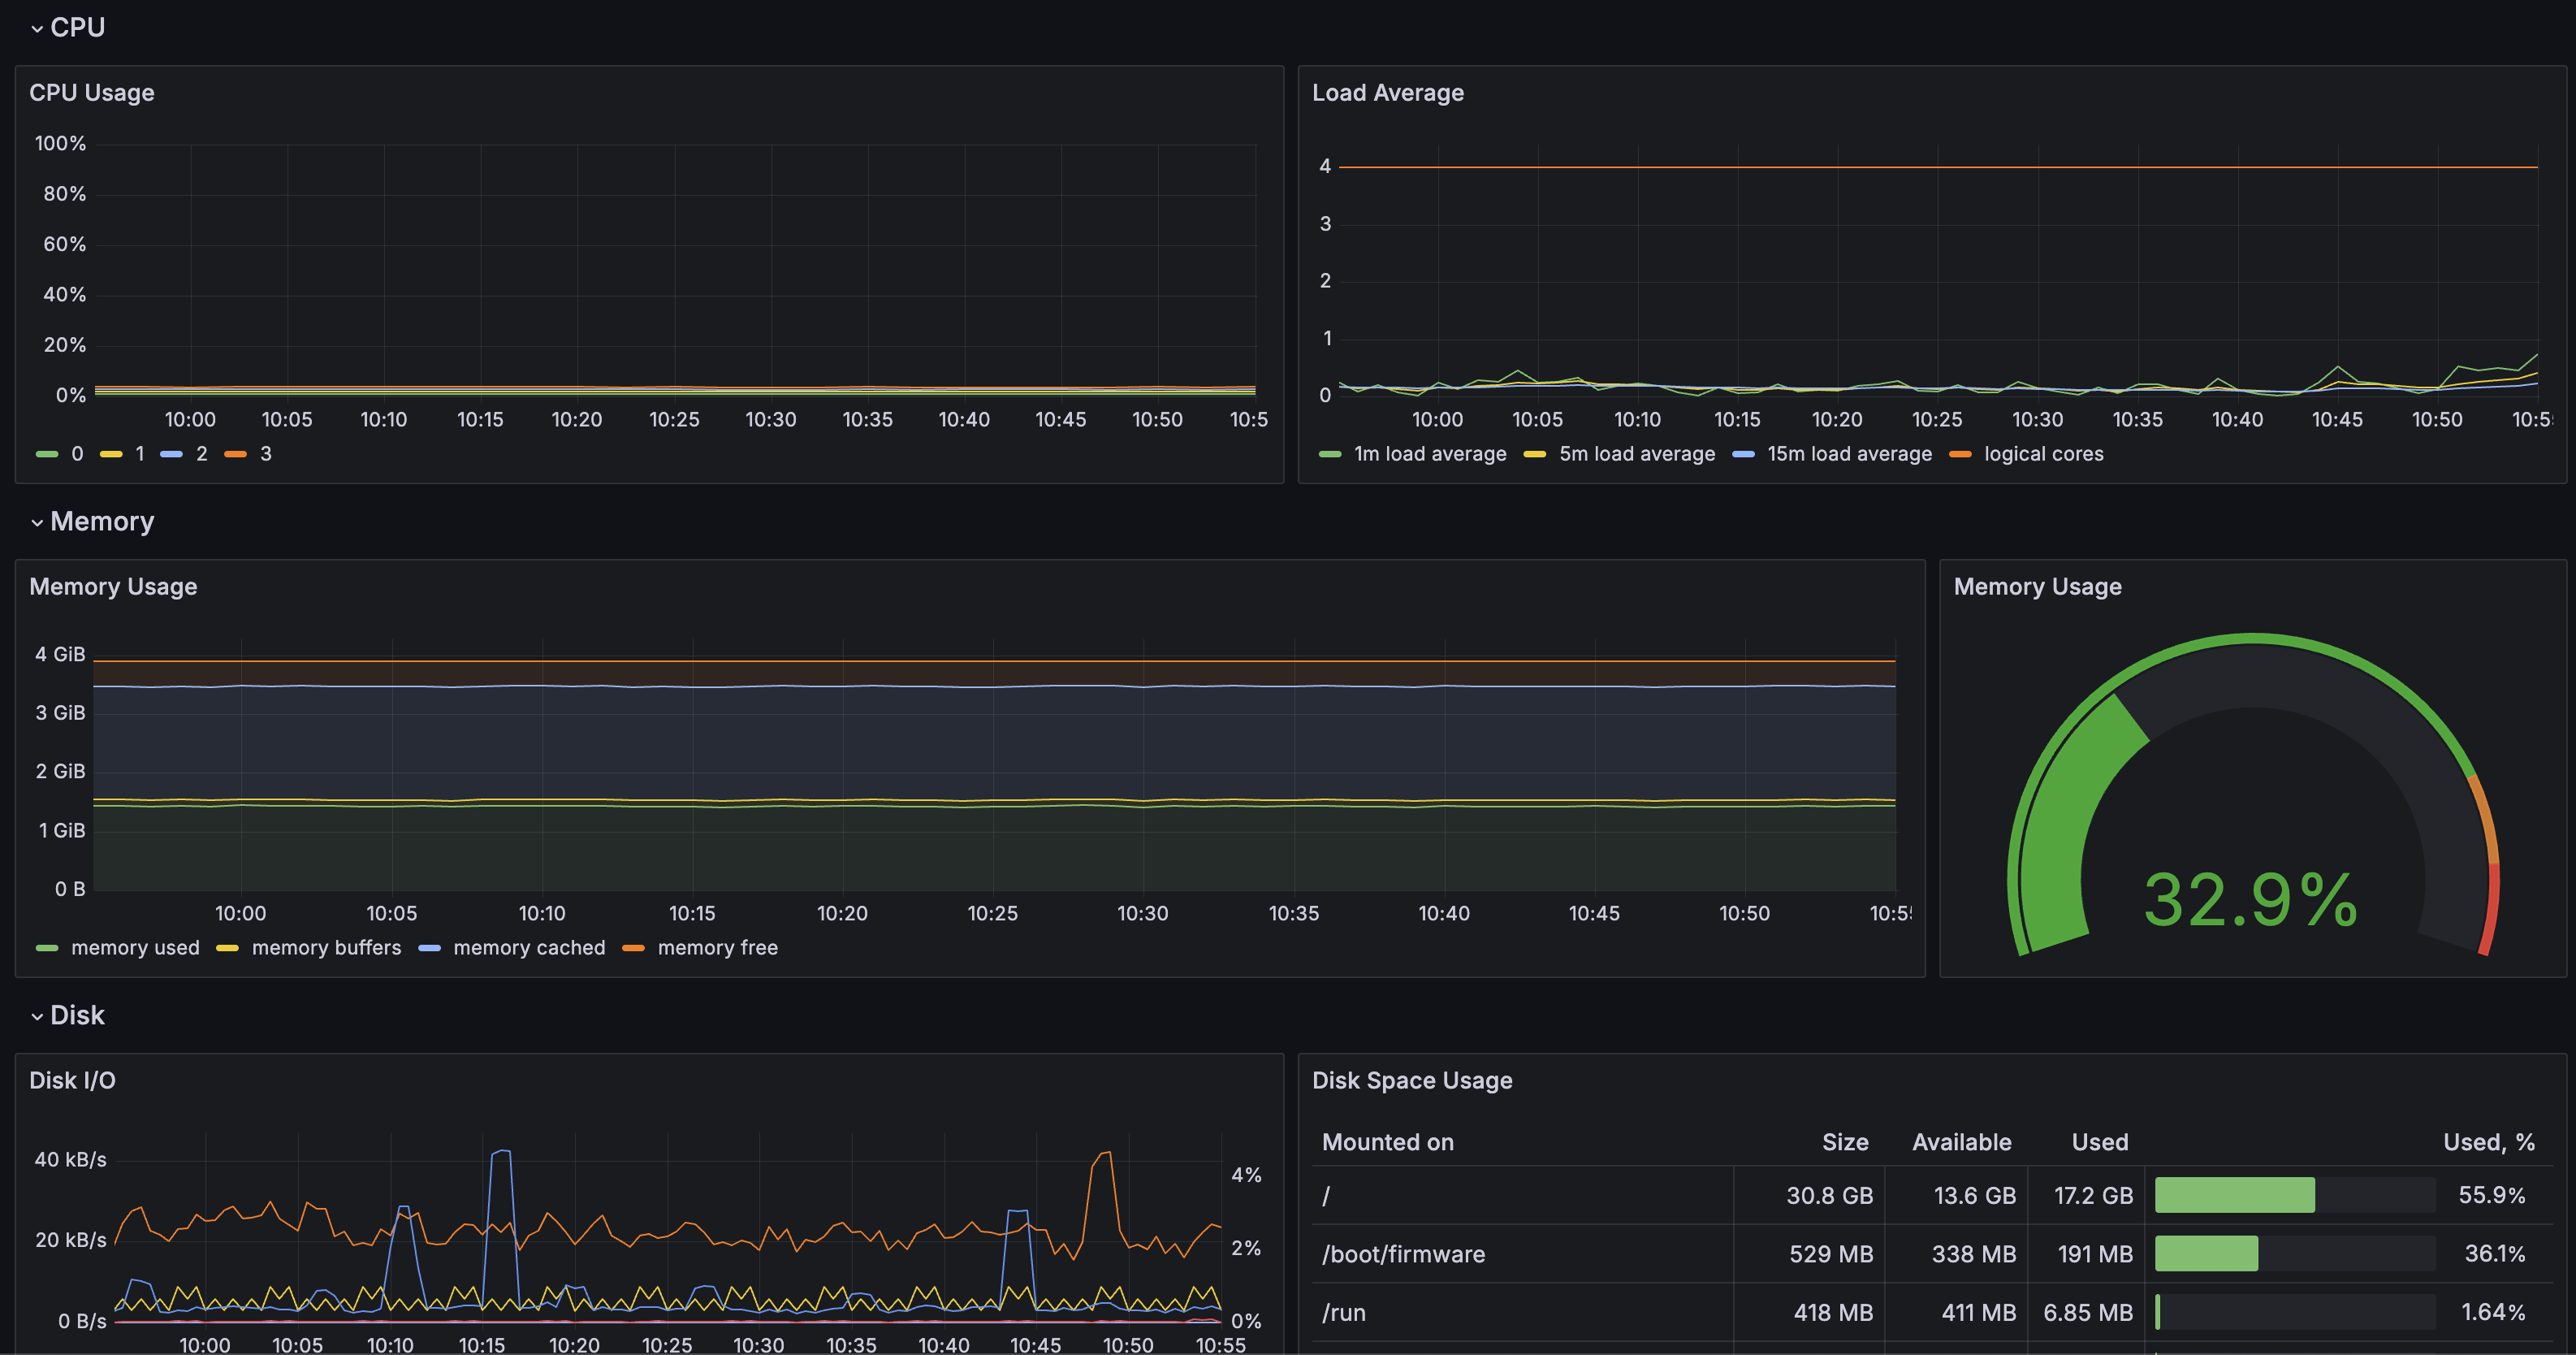
There should also be a node exporter dashboard:
