Kubernetes Dashboards
There are a lot of kubernetes components to keep track of. Today I am looking at some tools to make kubernetes easier to manage. In the kubernetes post, I deployed the kubernetes web based dashboard using a built in command for minikube. Let’s look at how to deploy the dashboard into any kubernetes distribution.
Kubernetes dashboard
Requirements
In order to deploy the kubernetes dashboard, you need to have a cluster configured. If you do not, check out the previous post on how to install minikube and gain access to that cluster’s API.
Deploy the dashboard
The dashboard can be deployed from the github manifest from the maintainers:
kubectl apply -f https://raw.githubusercontent.com/kubernetes/dashboard/v2.5.0/aio/deploy/recommended.yamlThis dashboard will have full access to the cluster so I recommend only accessing it during sessions when you can open a proxy into the cluster so that no one else can access the dashboard. This tool is not recommended for production setups but is a tool to learn the platform.
Create a user for the dashboard
Create a Service Account with the name admin-user in namespace kubernetes-dashboard
service-account.yaml
apiVersion: v1
kind: ServiceAccount
metadata:
  name: admin-user
  namespace: kubernetes-dashboard
Apply the manifest to your cluster:
kubectl apply -f service-account.yamlAssign permissions to service account
The service account that was just created needs to be assigned broad permissions to perform the functions on the dashboard. We can assign the permissions with another yaml manifest.
rbac.yaml
apiVersion: rbac.authorization.k8s.io/v1
kind: ClusterRoleBinding
metadata:
  name: admin-user
roleRef:
  apiGroup: rbac.authorization.k8s.io
  kind: ClusterRole
  name: cluster-admin
subjects:
  - kind: ServiceAccount
    name: admin-user
    namespace: kubernetes-dashboard
Apply the manifest to your cluster:
kubectl apply rbac.yamlCreate a token to use to login with the service account
Now enter this command to generate a token for the service account that was just created.
kubectl -n kubernetes-dashboard create token admin-userCopy this token and use that to log into the kubernetes dashboard.
Open a proxy connection to the kubernetes API
kubectl proxyAccess the dashboard
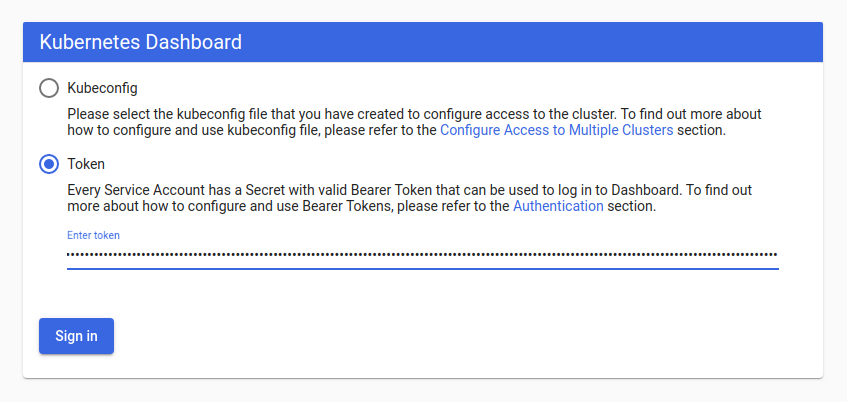
In a web browser, the dashboard should now be accessible here:
Enter the token from the previous step here to log in:
Deploy an application
After logging in with the token, select the plus + sign at the top of the web page. Then select “Create from form”:
We can deploy a container image easily just like with a docker command.
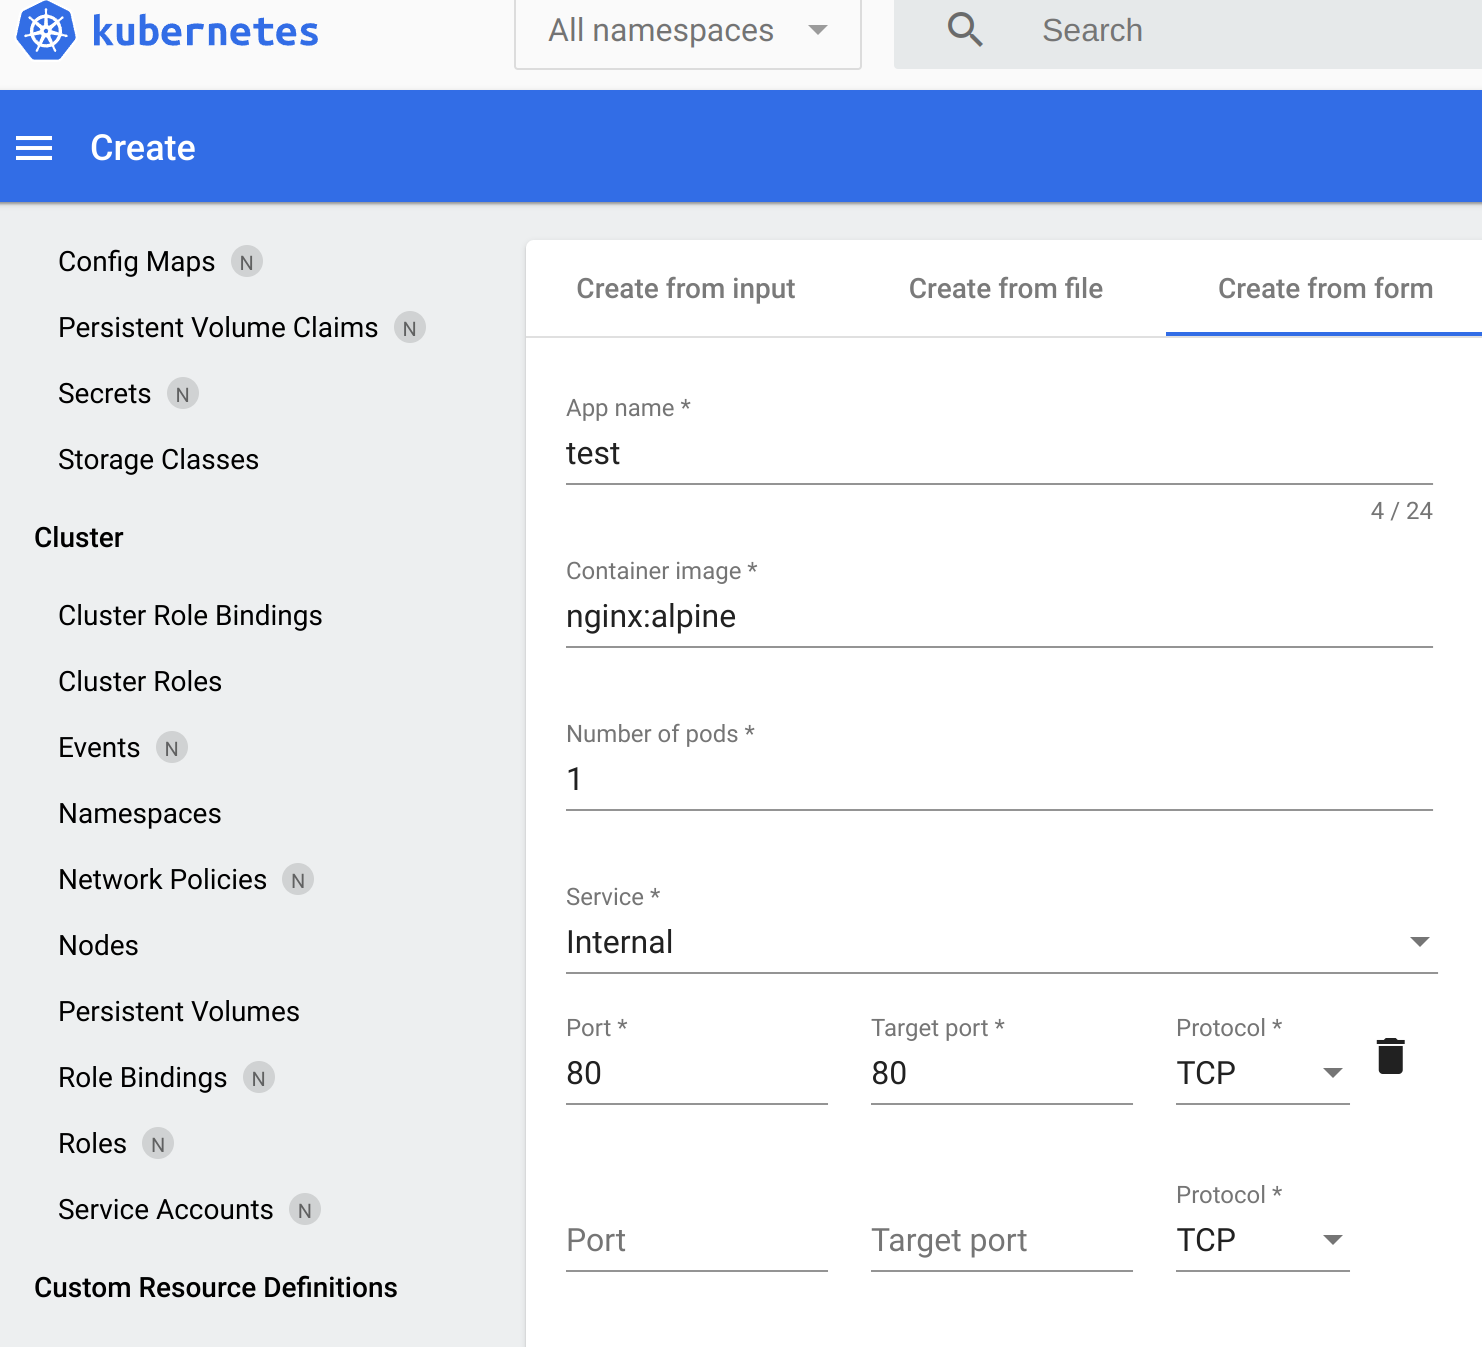
Next, select “Advanced Options” and find the section for “Namespace” and select “Create new namespace”
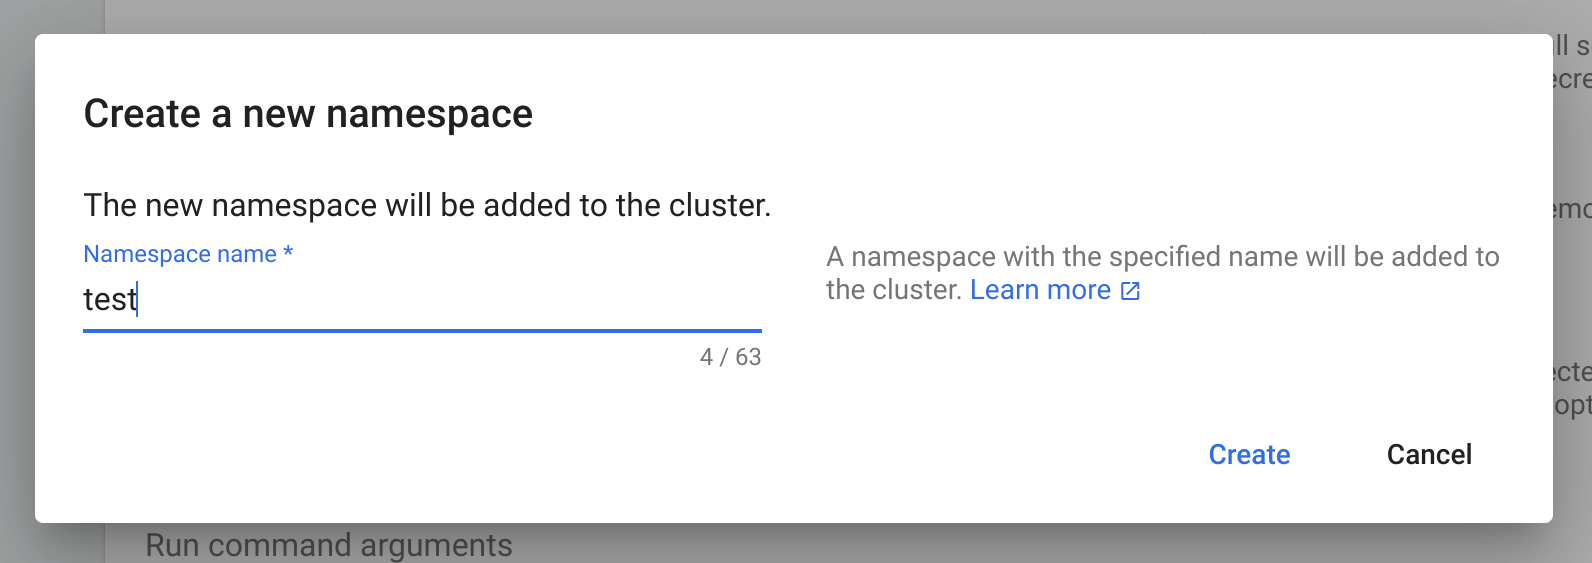
Scroll down and select “Deploy” to create this deployment.
Connect to the container
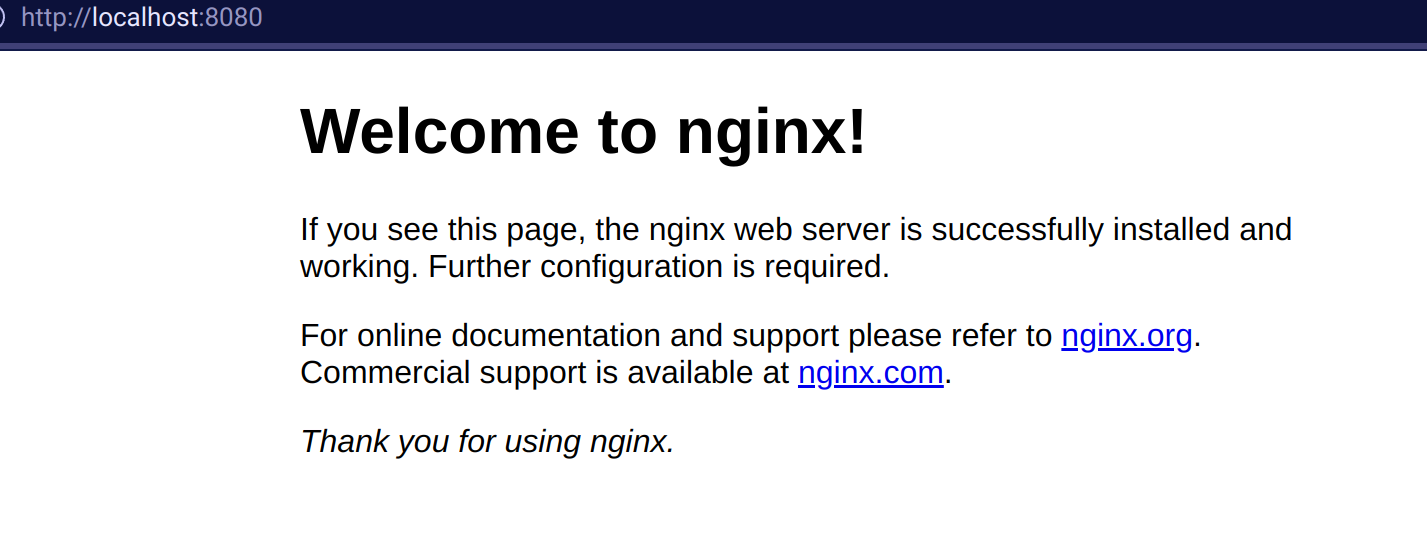
Now we can port-forward from this container to the local machine to test the simple web server:
kubectl port-forward svc/test -n test 8080:80Keep that terminal open and you can view the web server in your browser:
Next steps
Select the “test” namespace in the drop down menu near the top of the screen, and now spend some time exploring the dashboard, the navigation menu on the left will show you where you can look for resources that were deployed to the cluster.
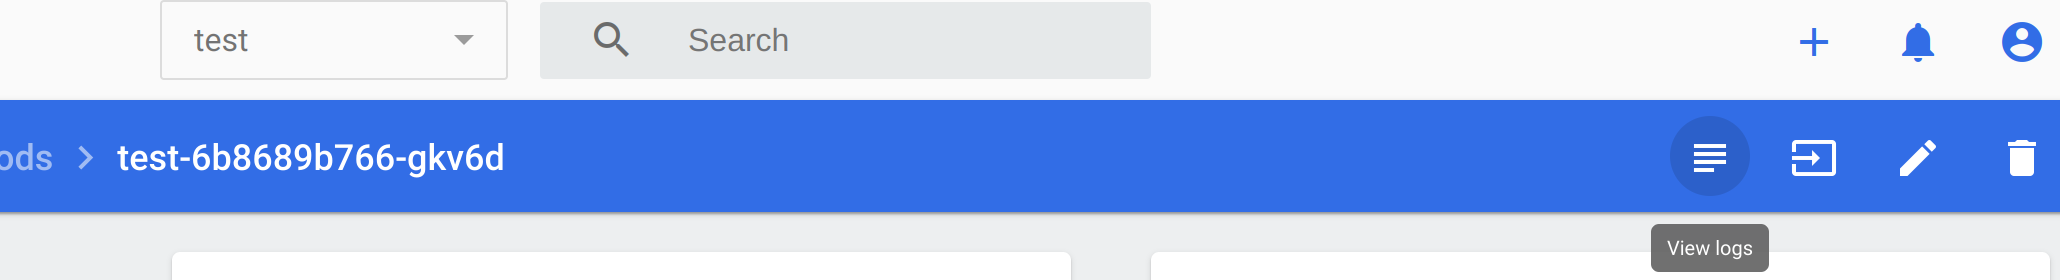
Select “Pods” and you can inspect the pod that was created in the previous steps. After selecting the pod, the kubernetes dashboard has options to view the pod’s logs and open a shell into the container in the pod. The Highlighted option below is to view the pod’s logs and the icon to the right is to Exec into the pod’s shell.
Clean up
To clean up these resources, delete the associated namespaces:
kubectl delete namespace testkubectl delete namespace kubernetes-dashboardk9s
Next I am going to look at a tool that allows you to navigate a kubernetes cluster through the terminal and it is called k9s. This program will provide a visualization of all the commands you can run with kubectl in a terminal window.
k9s installation
Install on Windows
I recommend installing this software with Chocolatey. If you are not familiar with Chocolatey, I suggest checking out my previous post. Once you have Chocolatey installed you can install k9s with one command:
choco install k9sInstall on macOS
I would recommend installing k9s with homebrew. Once you have homebrew, you can install k9s with one command:
brew install k9sInstall on Linux
The easiest way to use on various linux distributions is to download the latest version of the k9s executable and execute it directly.
The latest release is published here on GitHub.
updated command 04-18-23
wget https://github.com/derailed/k9s/releases/download/$LATEST_VERSION/k9s_Linux_amd64.tar.gz
tar -xvf k9s_Linux_amd64.tar.gz
This will download and extract the k9s binary. Now we can move it to /usr/local/bin/ so that you can just type k9s in the terminal to launch it.
sudo cp k9s /usr/local/bin
sudo chmod 751 /usr/local/bin/k9s
The second command will ensure that the file is executable which means that you can launch it by typing in k9s
Using k9s
After you installed k9s, just open a terminal and type k9s to open the program and connect to whatever cluster you have defined for your .kubeconfig.
k9sIf you work with multiple clusters, you can add the flag --cluster <cluster_name> or point to another kubeconfig file with the flag --kubeconfig path/to/kubeconfig
This program uses the same navigation keys as the vi editor. Pressing : will open the command prompt. Enter “pods” and press enter to view all pods.
Press 0 to show pods from all namespaces.
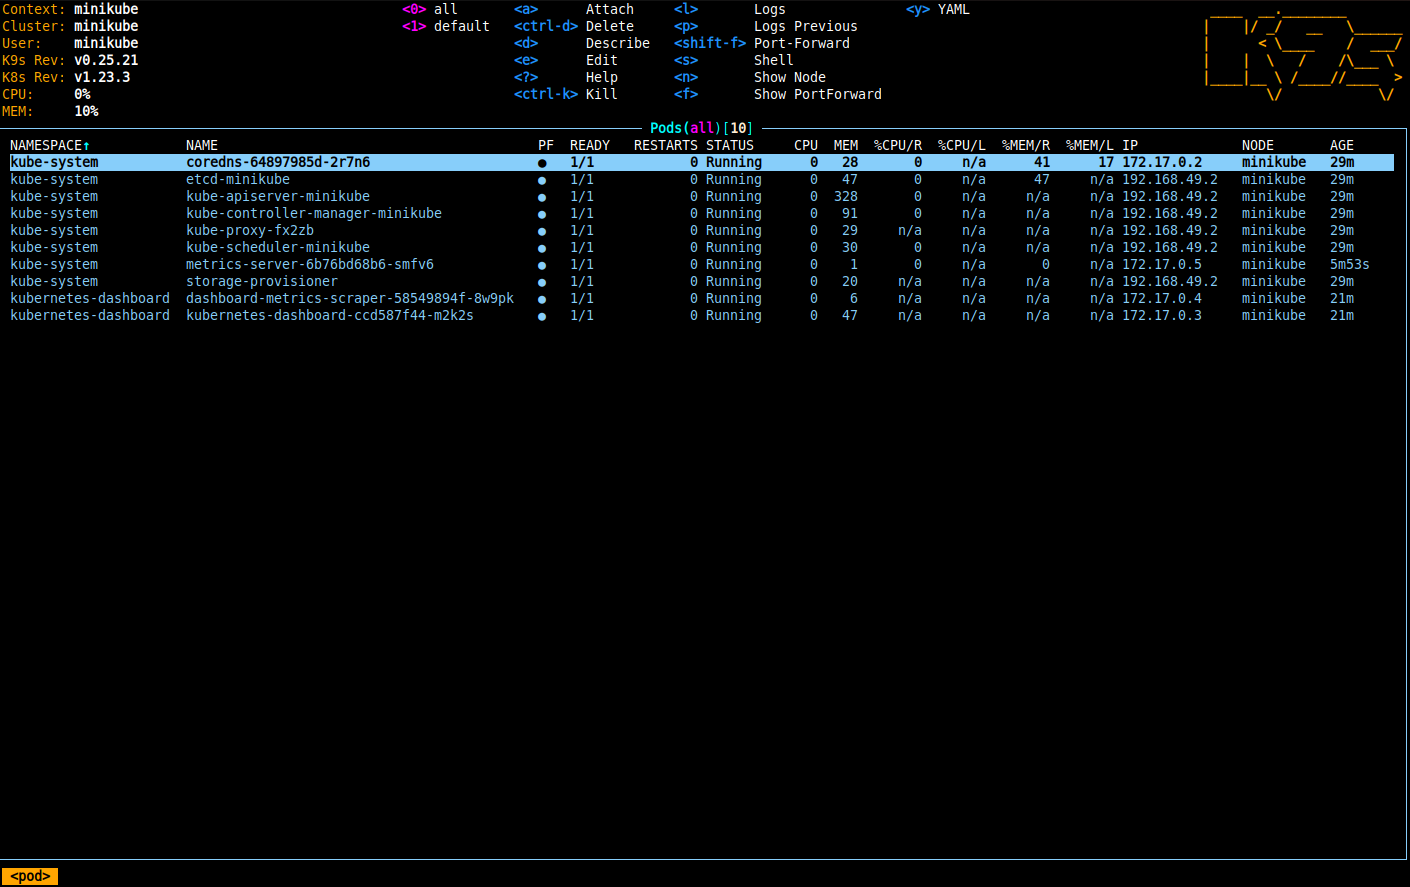
You can use the arrow keys to select different pods that are running in kubernetes.
From here if you look at the top of the screen, you can perform various operations on pods. You can view the logs of containers, attach to the shell of the containers, view the configuration, open a port forward connection to your local machine, delete the pod, and there are even more options.
There is also a menu for seeing an overview of the cluster. Pressing : will open the command prompt. Enter “pulses” and press enter to view.
When opening the pulses menu, there may not be any information without installing the kubernetes metrics server. To install the metrics server:
kubectl apply -f https://github.com/kubernetes-sigs/metrics-server/releases/latest/download/components.yamlIf using minikube, enable through the addon:
minikube addons enable metrics-server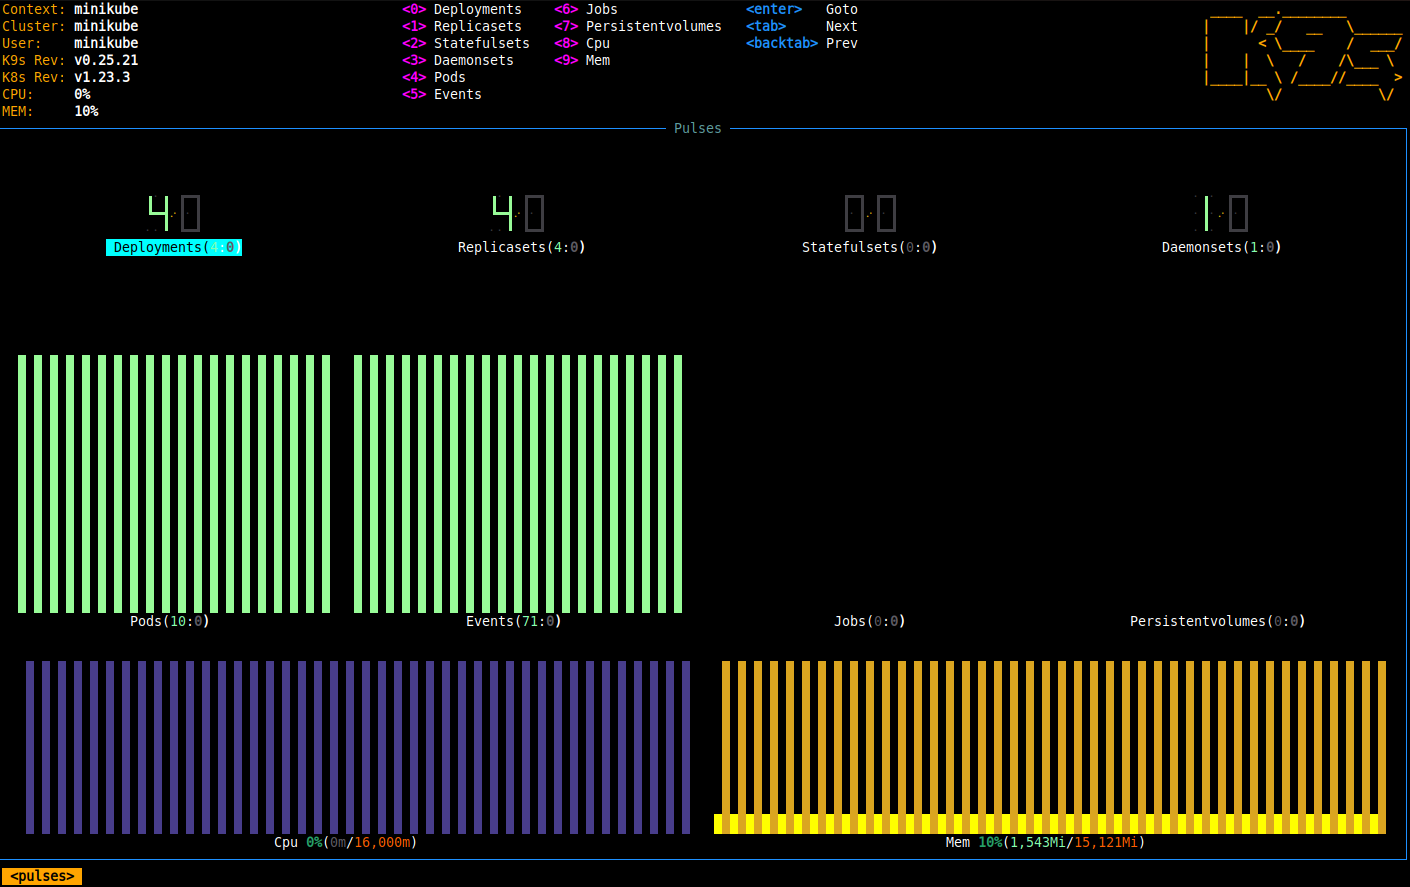
The k9s program can be used to view any object in the cluster and that includes any custom resource definitions. This is my go to tool for troubleshooting kubernetes clusters.
Exit k9s
You can exit k9s the same way as the vi editor. Pressing : will open the command prompt. Enter q to quit the program.