Self-Host n8n in Your Homelab (Docker Compose + Caddy)
New disclaimer I am adding: I used an LLM to help create this post but afterwards I spent more than an hour editing it to the final form.
This tool n8n allows you to build automated workflows with AI agents through a “node” based UI in the web. It also has a REST API and you can define the workflows in JSON. We can configure webhooks to allow systems to trigger workflows in n8n.
My homelab consists of many different systems including Raspberry Pis, Mac Mini, Synology and Linux mini pcs. n8n ties that whole stack together. I see n8n as a tool very similar to Jenkins but the way you build workflows by using “nodes” opens things up automation to folks who may not be technical or want to mess around with Groovy files for Jenkins. There also seem to be far more usable plugins/integrations for n8n that make it more useful than software like Jenkins. There are also integrations with LLMs allowing you to create AI agents to accomplish tasks that were not possible before.
In this post I will show how I deploy n8n with Docker Compose behind my existing Caddy reverse proxy, enable Prometheus metrics, and build a workflow that keeps tabs on systems with important storage.
What you’ll need to follow
- Preferably a Linux system with Docker Engine and Docker Compose plugin installed. If you are not familiar with containers, check out a previous post for an introduction.
- Caddy reverse proxy already handling TLS for your lab services. Check out a previous post to get started with Caddy.
- Prometheus + Grafana stack reachable on the network. If you are not familiar with this stack, check out a previous post to get started.
- A domain or internal DNS entry (e.g.
n8n.example.lan) pointing at the container host. - Basic CLI and YAML editing skills.
Reminder: Self-hosting means you own the updates, security, and backups. If you want something managed, n8n Cloud available to avoid managing the application and backend yourself.
Network map
Clients --> Caddy (443/HTTPS) --> n8n container (5678)
Metrics exposed at the same host under /metrics (for example https://n8n.example.lan/metrics)
Step 1: Prep the host directories
Create a dedicated directory to store n8n data.
mkdir -p n8n/local-files
cd n8n

# create a shared Docker network once; skip if it already exists
docker network create homelab-net
Step 2: environment file
Populate a file .env with the secrets and toggles n8n needs. Replace values to match your DNS, credentials, etc.
# URL that Caddy will front
N8N_DOMAIN=n8n.example.lan

# Postgres credentials
POSTGRES_USER=n8n
POSTGRES_PASSWORD=choose_a_strong_password
POSTGRES_DB=n8n

# Enable built-in Prometheus metrics
N8N_METRICS=true
ENV
Set optional labels or queue metrics (for example N8N_METRICS_INCLUDE_QUEUE_METRICS=true) if you want deeper visibility. Refer to the n8n Prometheus docs for the full list of N8N_METRICS_INCLUDE_* flags.
Step 3: Docker Compose file
It is recommended to configure n8n to use a Postgresql server to store persistent data. We can deploy this as a container alongside n8n and attach everything to the same Docker network that Caddy and Prometheus use.
Create a new file docker-compose.yml:
services:
  n8n:
    image: n8nio/n8n:latest
    environment:
      - N8N_HOST=${N8N_DOMAIN}
      - N8N_PORT=5678
      - N8N_PROTOCOL=https
      - N8N_EDITOR_BASE_URL=https://${N8N_DOMAIN}
      - N8N_SECURE_COOKIE=true
      - DB_TYPE=postgresdb
      - DB_POSTGRESDB_HOST=db
      - DB_POSTGRESDB_PORT=5432
      - DB_POSTGRESDB_DATABASE=${POSTGRES_DB}
      - DB_POSTGRESDB_USER=${POSTGRES_USER}
      - DB_POSTGRESDB_PASSWORD=${POSTGRES_PASSWORD}
      - N8N_METRICS=${N8N_METRICS}
      - NODE_FUNCTION_ALLOW_BUILTIN=*
      - NODE_FUNCTION_ALLOW_EXTERNAL=axios
    ports:
      - 5678:5678
    volumes:
      - n8n_data:/home/node/.n8n
      - ./local-files:/files
    depends_on:
      - db
    networks:
      - homelab-net
    restart: unless-stopped

  db:
    image: postgres:16-alpine
    environment:
      - POSTGRES_USER=${POSTGRES_USER}
      - POSTGRES_PASSWORD=${POSTGRES_PASSWORD}
      - POSTGRES_DB=${POSTGRES_DB}
    volumes:
      - postgres_data:/var/lib/postgresql/data
    networks:
      - homelab-net
    restart: unless-stopped

volumes:
  n8n_data:
  postgres_data:

networks:
  homelab-net:
    external: true
Step 4: Start the containers
Bring everything up:
docker compose up -dVerify containers are healthy and listening.
docker compose psIf a container misbehaves, inspect with docker compose logs.
Step 5: Wire n8n through Caddy (optional)
Expose n8n behind the existing Caddy reverse proxy container. Make sure your Caddy service joins the same homelab-net network, then drop a site block like this into your Caddyfile (or a snippet if you split configs per service).
n8n.example.lan {
  encode gzip
  tls youremail@example.com

  reverse_proxy n8n:5678 {
    transport http {
      versions h2c 1.1
    }
  }
}
Reload Caddy inside the container to apply the change.
docker compose exec caddy caddy reload --config /etc/caddy/CaddyfileBrowse to https://n8n.example.lan and walk through the initial owner account wizard.
Step 6: Point Prometheus at n8n (optional)
Add a scrape job so Prometheus collects metrics from n8n. If Prometheus is running on the same Docker network you can scrape the service directly.
scrape_configs:
  - job_name: 'n8n'
    metrics_path: /metrics
    static_configs:
      - targets: ['n8n:5678']
If you prefer to run the scrape through Caddy, swap the target for n8n.example.lan and set scheme: https.
Reload Prometheus or push the config update through whatever management you use (Ansible, GitOps, etc.). Grafana dashboards can now plot workflow executions, queue wait times, and other n8n counters.
Example workflow: Discord disk alert
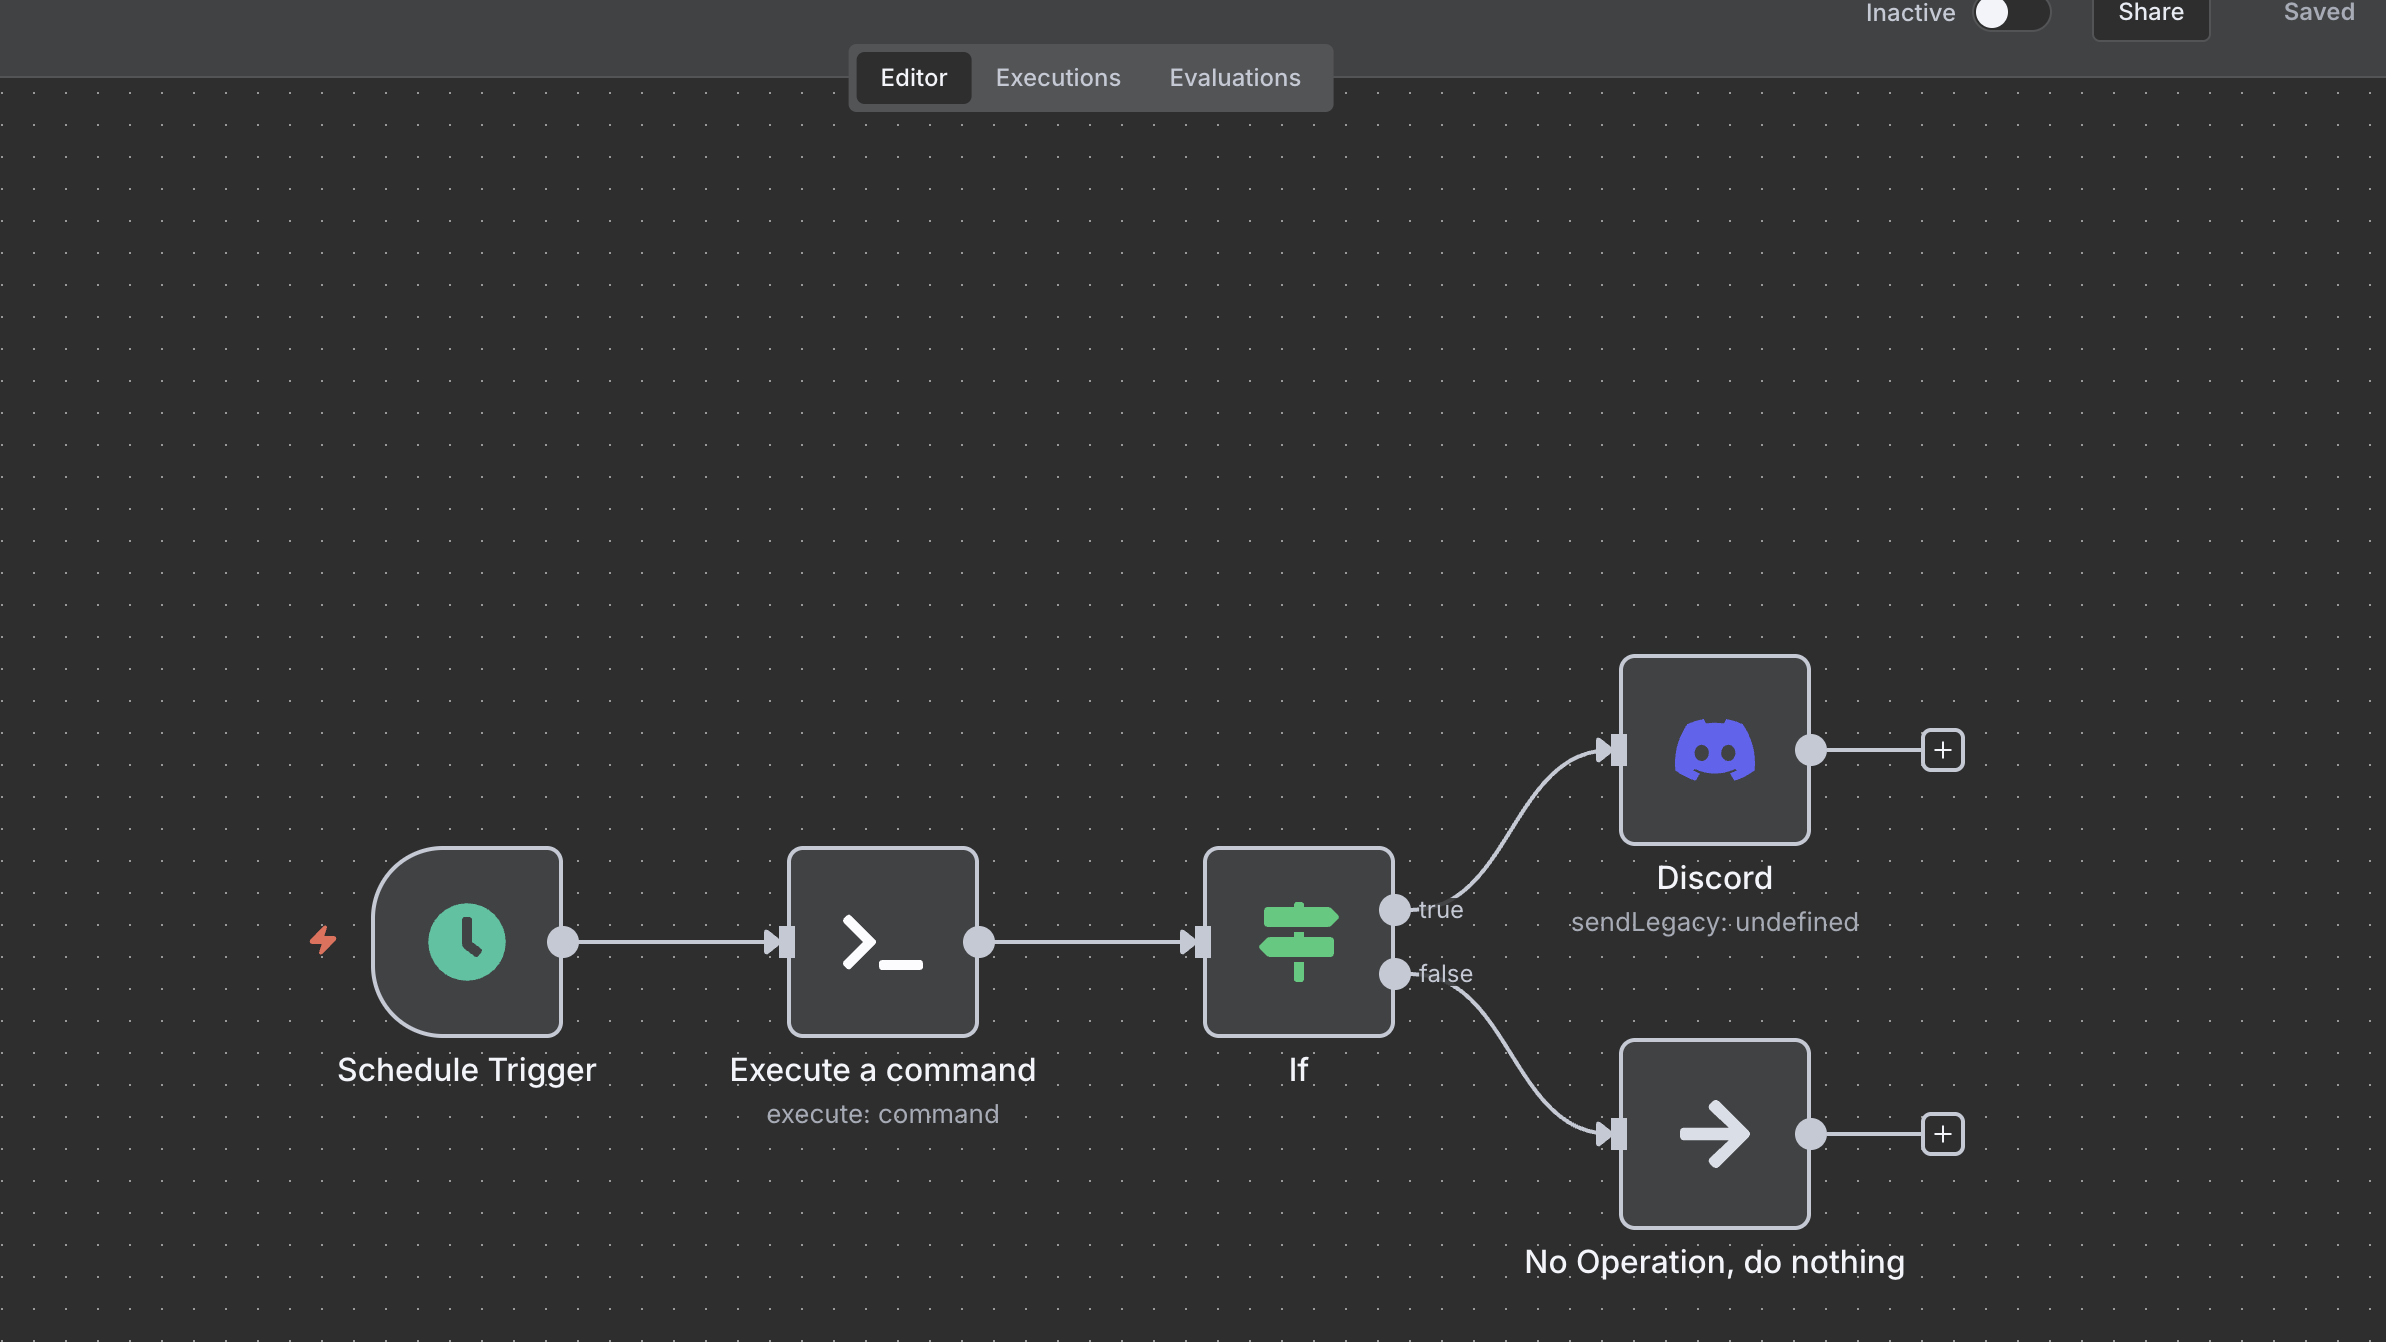
There are a ton of example workflows available online but I found it all overwhelming. I ended up creating workflow in the n8n UI that keeps an eye on the root filesystem of my Pi named alpha. It pings a Discord channel only when usage crosses 90%. Here’s how to build it yourself.
Create the workflow
-
Drag in a Schedule Trigger node. Set it to run every day at 06:00 so the message lands early
-
Add an Execute a command (SSH) node. Point it at your host using credentials configured in Settings → Credentials. Set the command to:
df -k / | tail -1 | awk '{print $5}'That prints the used percentage, e.g.
58%. That value is now accessible in subsequent nodes as{{$json.stdout}}. -
Add in an IF node. Configure a single condition that checks whether
={{ parseInt($json.stdout) }}is greater than90. I keep the comparison strict so only numbers above 90 trigger. -
On the true branch add a Discord node (Webhook auth). Pick the webhook credential you created in the UI and set the message body to something like:
**Warning**: Disk usage above 90 percent on pi alpha. Current usage of root volume is: {{$json.stdout}}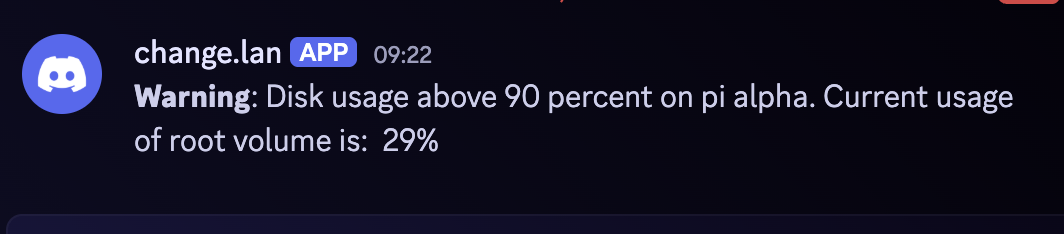
-
On the false branch I left a No Operation node so the workflow always terminates cleanly, but you can remove it if you prefer.
-
Toggle the workflow to Active when you’re ready.
Credential setup
- SSH Password account: store the host/IP and username for the device you’re monitoring. I’m using password auth to test out n8n, but swapping to an SSH key for credentials works the same and I believe is more secure.
- Discord Webhook account: create the webhook in Discord, paste the URL into n8n’s credential, and reference it from the Discord node.
Duplicate the workflow for other systems by cloning the SSH credential (or switching to key auth) and updating the message text. If you want to watch multiple mount points on the same box, change the command to df -k /NAME_OF_MOUNTPOINT and adjust the wording accordingly.
Hardening and maintenance tips
- Backups: backup the data in the postgresql database
- Updates: pull and redeploy containers at least monthly.
docker compose pull docker compose up -d - Secrets: use n8n credential nodes for API keys; restrict SSH keys to the limited command set you need.
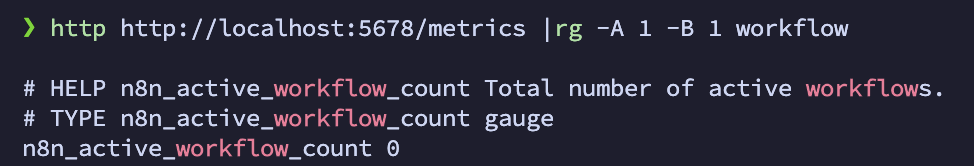
- Resource monitoring: Prometheus now has
n8n_active_workflow_countand this metric can show how active n8n is at a given time.
Troubleshooting cheatsheet
docker compose logs n8nfor startup and workflow execution errors.- If the UI times out behind Caddy, confirm WebSocket upgrades pass through (Caddy handles them automatically) and that HTTP/2 cleartext is enabled.
- Prometheus scrape errors usually mean the
/metricshandler is not exposed—verify port5678is reachable or that your reverse proxy forwards/metricscorrectly.
Next steps
Grok (xAI’s LLM) scraped twitter and gave some ideas, not sure how feasible they are:
- Voice-to-Task Capture (iOS + n8n)
- Record thoughts via iOS Shortcuts, transcribe with AI, and log to Todoist/Notion/similar app
- Workflow Sketch: Shortcut webhook → Whisper transcription → AI categorization → App sync.
- Benefits: Captures ideas on-the-go; turns vague notes into actionable lists, saving time and transcribing notes.
- Grocery and Home Management Alerts
- Monitor store flyers/APIs for deals, match against your shopping list, and notify via SMS.
- Workflow Sketch: RSS trigger → List comparison node → Push notification.
- Benefits: Streamlines chores; extends to bill reminders or smart home integrations.
- Knowledge Acquisition from Newsletters
- Pull RSS feeds, summarize articles with AI agents, and store in a personal database.
- Workflow Sketch: Schedule pull → AI summary → Database upsert.
- Benefits: Builds a searchable “second brain” without manual reading; great for lifelong learners.
- Social Media Content Pipeline
- Generate post ideas from trends, draft with AI, and schedule to Buffer/Twitter
- Workflow Sketch: Trend API → LLM ideation → Approval + scheduler.
- Benefits: Consistent posting without burnout; analytics loop for refinement.
Out of these I am most interested in #1 and #3.
New disclaimer I am adding: I used an LLM to help create this post but afterwards I spent more than an hour editing it to the final form.