Setting up Network UPS tools
The primary goal of the Network UPS Tools (NUT) project is to provide support for Power Devices, such as Uninterruptible Power Supplies, Power Distribution Units, Automatic Transfer Switches, Power Supply Units and Solar Controllers. Some of those sound exciting but at this time I only have Uninterruptible Power Supplies.
My environment has 5 UPS devices connected to various servers and networking equipment. They also are not the same model or vendor. Fortunately NUT supports most consumer UPS devices that have a usb port. The goal is to use NUT to create some logic to safely shut down devices when electricity fails for an extended period. UPS devices work well with zero configuration to protect equipment from brief interruptions in power (brownouts). When the power goes out for more than a few minutes, NUT can be used to safely power down systems even if they are not all connected to the UPS via usb. NUT has a server => client configuration using a network port. This allows servers that are not connected to the UPS to respond to power outages.
Install NUT
Initially I planned to create some automation to install and configure NUT but since all my devices are different, it will be faster to document the procedure and configure each device.
My physical servers are debian based. If on debian or ubuntu linux, install the following packages to support Network UPS tools:
sudo apt update && sudo apt install nut nut-client nut-serverNUT also has packages for other distributions of Linux as well as FreeBSD and a beta installer for Windows.
https://networkupstools.org/download.html
The rest of the post has instructions for linux servers with consumer UPS connected via usb.
Scan for compatible UPS devices
Ensure that one or more UPS is connected to a usb port on the linux system. Run the following command to view NUT supported devices:
nut-scanner -UIf connected via USB, it should likely look similar:
SNMP library not found. SNMP search disabled.
Neon library not found. XML search disabled.
IPMI library not found. IPMI search disabled.
Scanning USB bus.
[nutdev1]
	driver = "usbhid-ups"
	port = "auto"
	vendorid = "1234"
	productid = "4321"
	product = "foo"
	vendor = "bar"
	bus = "001"
Note the driver, port, vendorid, and productid to add in the next section.
Configure
This information is needed to add to the configuration. The name and description are up to you. Edit the file:
/etc/nut/ups.conf
[name-your-device]
    driver = usbhid-ups
    port = auto
    desc = "Describe your device"
    vendorid = bar
    productid = foo
Next configuration is in:
/etc/nut/upsmon.conf
For localhost usage, add a line to monitor the device configured in ups.conf
RUN_AS_USER root
MONITOR <device_name>@localhost 1 admin <new_password> master
Next is ups daemon config. This config creates binds to port 3493 on the localhost address. This means the connections are limited to the local server. Edit the file:
/etc/nut/upsd.conf
LISTEN 127.0.0.1 3493Next is nut config. This configures whether you want NUT to run locally or expose the server for other systems to connect. Edit the file:
/etc/nut/nut.conf
MODE=standaloneIn the upsmon.conf the admin user was specified. This needs to be created in /etc/nut/upsd.users
[admin]
  password = <password_from_upsmon.conf>
  admin master
Now services must be restarted to reload configurations:
systemctl restart nut-server
systemctl restart nut-client
systemctl restart nut-monitor
Check if the configuration works with the upsc command:
upsc <device_name>@localhostYou should see output with information about the UPS device:
Init SSL without certificate database
battery.charge: 100
battery.charge.low: 10
battery.charge.warning: 20
battery.mfr.date: CPS
battery.runtime: 981
battery.runtime.low: 300
battery.type: PbAcid
battery.voltage: 14.3
battery.voltage.nominal: 12
...
...
...
Configure NUT for multiple clients
The above configuration will work for a single server connected to one (or more) UPS devices. If you are crazy like me and have 5 servers, a more complex setup may be needed.
For example, I have two physical locations with unequal amounts of servers and some of my servers are Raspberry Pi devices which only use 5 watts. In one location, there are two servers connected to one UPS and another two servers are connected to a different UPS. With the configuration above, I can connect the UPS to one server via usb but for each UPS, one of my servers will not be able to detect changes to the UPS. We can configure the servers that are connected to the UPS to make the ups-server available over the local network.
Reconfigure NUT server
Change the nut configuration on the system that has the ups connected /etc/nut/nut.conf
MODE=netserverChange the listen address in /etc/nut/upsd.conf
LISTEN 0.0.0.0 3493Add a user for remote clients to use in /etc/nut/upsd.users
...
...
[upsmon]
  password = password
  upsmon slave
Once the changes are made, restart the services again.
Configure nut client
If the system doesn’t have the ups connected, you only need to install the nut client.
sudo apt install nut-clientNow configure nut as a client in /etc/nut/nut.conf:
MODE=netclientFinally, configure the ups monitor in /etc/nut/upsmon.conf and replace nut-server with your nut server hostname or IP address.
MONITOR <device_name>@nut-server 1 upsmon <new_password> slaveRestart nut-client and nut-monitor to load the configuration.
systemctl restart nut-client nut-monitorVerify the client can contact the server that has the UPS connected:
upsc myups@nut-serverUPSsched
Now this step is optional. You can create a shell script to instruct upssched what to do during power events. Be very careful, the first time I used this it not only powered down the server but turned off the UPS which caused a network outage.
Edit the config /etc/nut/upssched.conf:
CMDSCRIPT /sbin/upssched-cmd

PIPEFN /run/nut/upssched.pipe
LOCKFN /run/nut/upssched.lock

AT ONBATT * START-TIMER onbatt 30
AT ONLINE * CANCEL-TIMER onbatt online
AT LOWBATT * EXECUTE onbatt
AT COMMBAD * START-TIMER commbad 30
AT COMMOK * CANCEL-TIMER commbad commok
AT NOCOMM * EXECUTE commbad
I created the script upssched-cmd. This goes in /sbin/ with other administrative binaries. Make sure the permissions are 751 and the file is owned by root.
#!/bin/sh
case $1 in
       onbatt)
          logger -t upssched-cmd "UPS running on battery"
          ;;
       earlyshutdown)
          logger -t upssched-cmd "UPS on battery too long, force shutdown"
          /usr/sbin/upsmon -c fsd
          ;;
       shutdowncritical)
          logger -t upssched-cmd "UPS on battery critical, force shutdown"
          /usr/sbin/upsmon -c fsd
          ;;
       upsgone)
          logger -t upssched-cmd "UPS communication failing"
          ;;
       *)
          logger -t upssched-cmd "Unrecognized command: $1"
          ;;
 esac
To be extra safe, reload the nut services as per above to make sure old upssched config is not in memory.
Install a prometheus exporter with docker
Prometheus can be used to collect UPS metrics. There is an existing container image to run the NUT exporter. Huge props to the creater of this exporter! Give them a star on GitHub.
This exporter needs to be added to the same container network where a prometheus server container is running to keep things simple and secure. See the previous post on prometheus for a complete docker-compose template. Make sure that the nut-exporter container is on the same docker network as prometheus server.
docker-compose.yml
version: '3.7'
services:
  nut-exporter:
    image: hon95/prometheus-nut-exporter:1
    restart: unless-stopped
    container_name: nut-exporter
    environment:
      - TZ=America/New_York
      - HTTP_PATH=/metrics
      # Defaults
      #- RUST_LOG=info
      #- HTTP_PORT=9995
      #- HTTP_PATH=/nut
      #- LOG_REQUESTS_CONSOLE=false
      #- PRINT_METRICS_AND_EXIT=false
    # ports:
    #   - "9995:9995/tcp"
Start the new container after updating docker-compose.yml. The tool will detect the new container and bring it up without disrupting other running containers:
docker compose up -dRunning exporter on raspberry pi
If you are using a raspberry pi or another system with the arm64 CPU architecture, the nut-exporter container can be built with docker-compose.
First, clone the repository:
git clone https://github.com/HON95/prometheus-nut-exporter.gitNow create a docker-compose.yml file in the present directory, not inside the new directory with the repository:
ls
prometheus-nut-exporterversion: '3.7'
services:
nut-exporter:
container_name: nut-exporter
image: 127.0.0.1:5000/nut-exporter
build:
context: ./prometheus-nut-exporter
dockerfile: Dockerfile
environment:
TZ: 'America/New_York'
HTTP_PATH: '/metrics'
expose:
- 9995
restart: unless-stoppedBefore starting the container, one edit is required inside the repository Dockerfile:
ls
docker-compose.yml  prometheus-nut-exporter

vim prometheus-nut-exporter/Dockerfile
Find the section on tini:
# Add tini to properly handle signals
ARG TINI_VERSION
#ADD https://github.com/krallin/tini/releases/download/${TINI_VERSION}/tini /tini
# -----------------------------------------------------------------ADD: -arm64
ADD https://github.com/krallin/tini/releases/download/${TINI_VERSION}/tini-arm64 /tini
RUN chmod +x /tini
Now the container can be built and run with docker-compose.
docker compose up -dConfigure prometheus server
Once NUT exporter is running, the prometheus server needs to be configured to monitor the new exporter. When nut-exporter and prometheus are on the same container network, you can configure the target for nut-exporter with just the name of the container. Update the prometheus server config:
/etc/prometheus/prometheus.yml
#Other jobs above
- job_name: 'nut'
  static_configs:
    # Insert NUT server address here
    - targets: ['nut-server:3493']
    #metrics_path: /nut
  relabel_configs:
    - source_labels: [__address__]
      target_label: __param_target
    - source_labels: [__param_target]
      target_label: instance
    - target_label: __address__
      replacement: nut-exporter:9995
Multiple NUT servers can be monitored, just add more targets.
Visualize new metrics with pre-made grafana dashboard
The aforementioned post included deploying grafana. Check it out for help getting grafana running. There are free dashboards available online:
https://grafana.com/grafana/dashboards/
There is a dashboard for NUT exporter.
At this time it has the ID 14371
-
Navigate to the left-hand menu and Select ”+” > “Import” > “Import via grafana.com”
-
Enter the ID of the dashboard you would like to import and then select “Load”
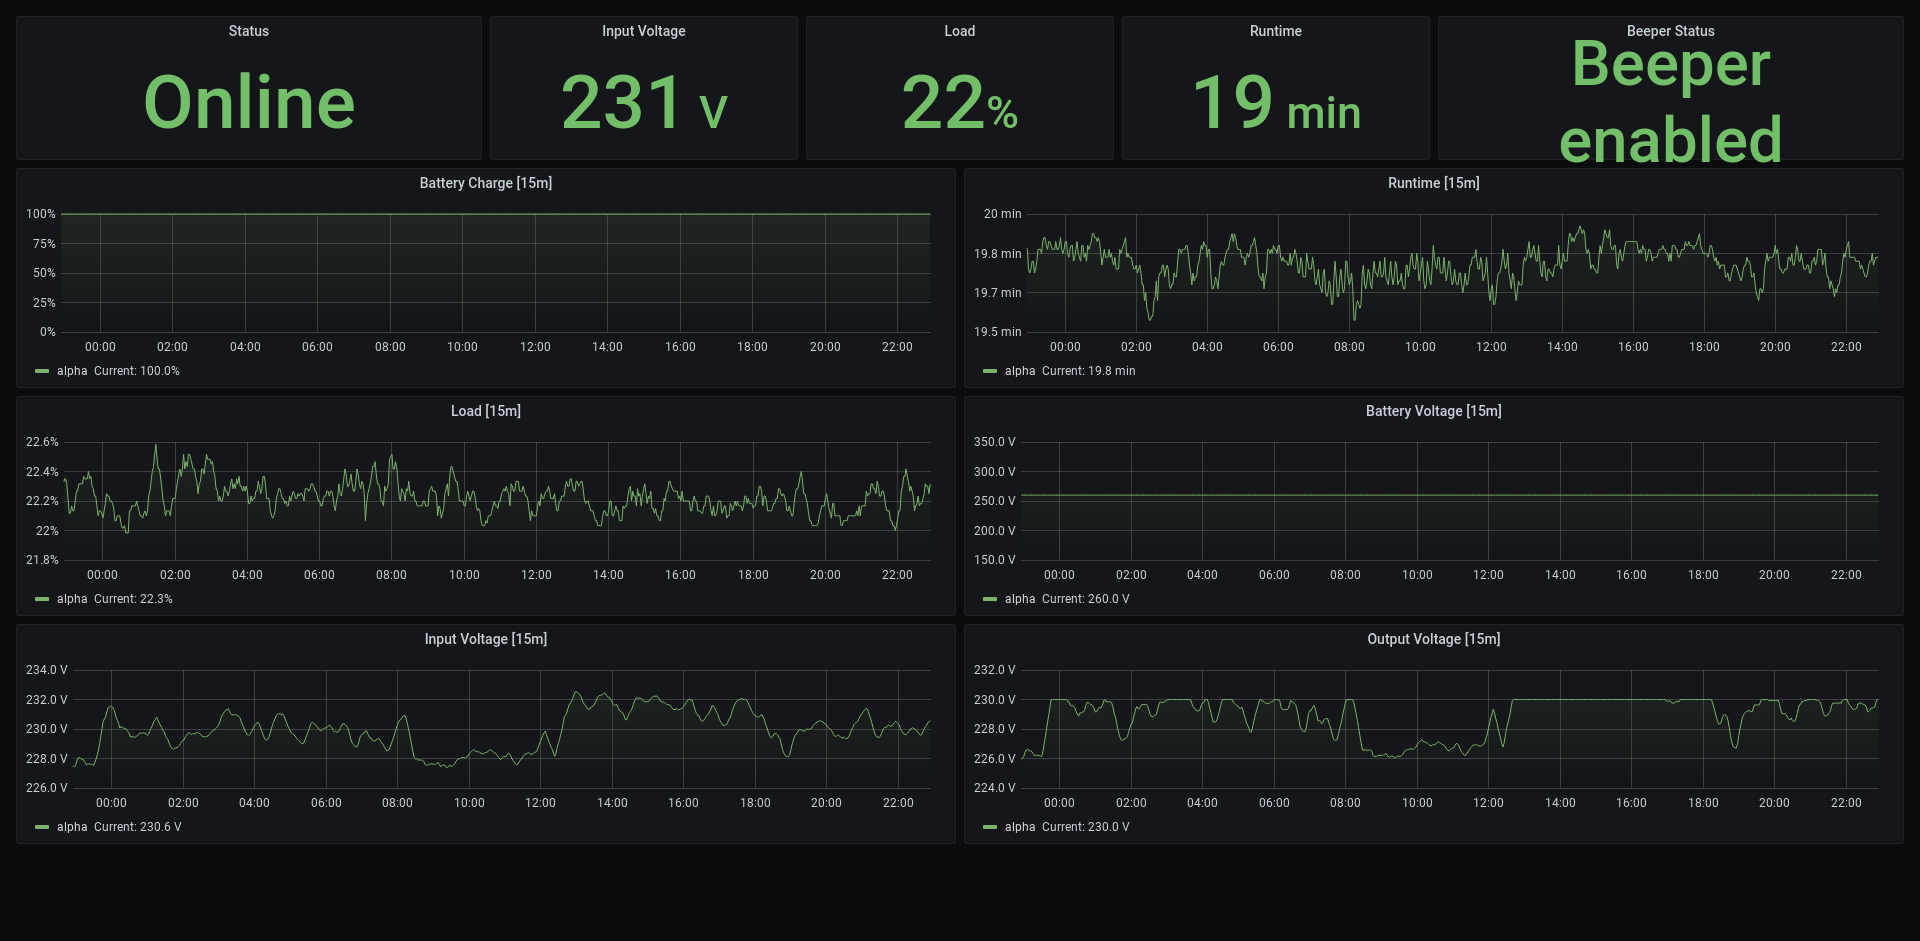
-
You should now see a dashboard like below.