Prometheus SNMP metrics on Synology
In this post, we’ll walk through setting up monitoring for a Synology NAS using the Prometheus SNMP Exporter, which taps directly into Synology’s official Management Information Bases (MIBs) to expose hardware-level metrics that other monitoring approaches simply can’t reach.
Prometheus is an open-source monitoring system that collects numeric metrics from targets at regular intervals, stores them in a time-series database, and lets you query that data. It integrates seamlessly with visualization tools like Grafana. If you are not familiar with Prometheus, check out a previous post to get started before diving into SNMP metrics.
SNMP (Simple Network Management Protocol) is a decades-old protocol that network devices and servers use to expose operational data. Synology NAS has an SNMP agent built right into DSM that can report hundreds of metrics about disk health, RAID status, temperatures, and system performance. It’s a common protocol that enterprise hardware supports for monitoring.
Monitoring a Synology NAS with Prometheus and SNMP
If you’re running a Synology NAS (or any NAS) as part of your homelab or production environment, you know how critical it is to keep tabs on its health. Hardware will fail it is just a matter of time.
While Synology’s DSM interface provides basic monitoring, integrating your NAS with Prometheus and Grafana unlocks customizable dashboards, historical data analysis, and alerting capabilities.
When you combine Prometheus with SNMP, you get the best of both worlds: Prometheus’s powerful time-series analysis and alerting capabilities, plus direct access to the detailed hardware metrics that Synology exposes through SNMP. The SNMP Exporter acts as a translator, converting SNMP’s format into Prometheus metrics.
Why SNMP Over Node Exporter?
The Prometheus Node Exporter can be forced to work on a Synology NAS but it will not include all of the hardware information that is available using SNMP.
For example:
| Feature | SNMP Exporter | Node Exporter |
|---|---|---|
| RAID Status | Full visibility into storage pool health | Usually hidden from containers |
| Drive Temperatures | Per-disk temperature monitoring | Not accessible |
| Volume Health | Detailed storage metrics | Limited visibility |
| Hardware Info | Fan status, UPS data, system temps | Generic system metrics only |
| Setup Complexity | Moderate (requires configuration) | Easy (standard container) |
| Security | SNMPv3 encryption available | Standard container security |
The SNMP approach lets you monitor your NAS without installing anything directly on it.
Architecture Overview
Here’s how the components work together:
┌─────────────────┐
│  Synology NAS   │
│  (SNMP Agent)   │◄────┐
│  Port 161       │     │
└─────────────────┘     │ SNMP Queries
                        │
                   ┌────┴────────────┐
                   │ SNMP Exporter   │
                   │ Port 9116       │◄────┐
                   └─────────────────┘     │
                                           │ HTTP Scrapes
                                      ┌────┴──────────┐
                                      │  Prometheus   │
                                      │  Port 9090    │
                                      └───────────────┘
                                             │
                                             ▼
                                      ┌───────────────┐
                                      │    Grafana    │
                                      │  Port 3000    │
                                      └───────────────┘
Step 1: Enable SNMP on Your Synology NAS
Before Prometheus can collect any metrics, we need to enable SNMP on the NAS itself.
- Log into your Synology DSM interface
- Navigate to Control Panel -> Terminal & SNMP -> SNMP tab
- Check Enable SNMP service
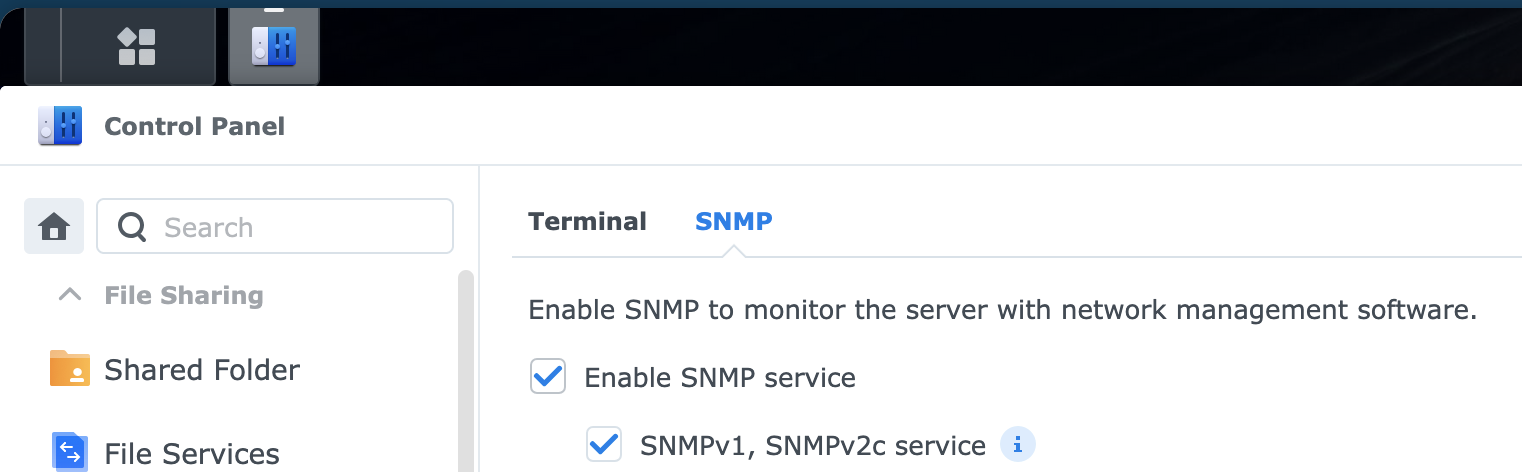
Choosing Your SNMP Version
You have two options:
SNMPv2c (Quick Setup):
- Community string authentication (like a shared password)
- No encryption
- Fine for trusted networks
- Default community string:
public(change this)
SNMPv3 (Recommended for Production):
- Username/password authentication
- Encryption support
- More secure, but requires additional configuration
- Configure auth protocol (MD5/SHA) and privacy protocol (DES/AES)
For this example, we’ll use SNMPv2c with a custom community string for simplicity, but I recommend SNMPv3 for production environments.
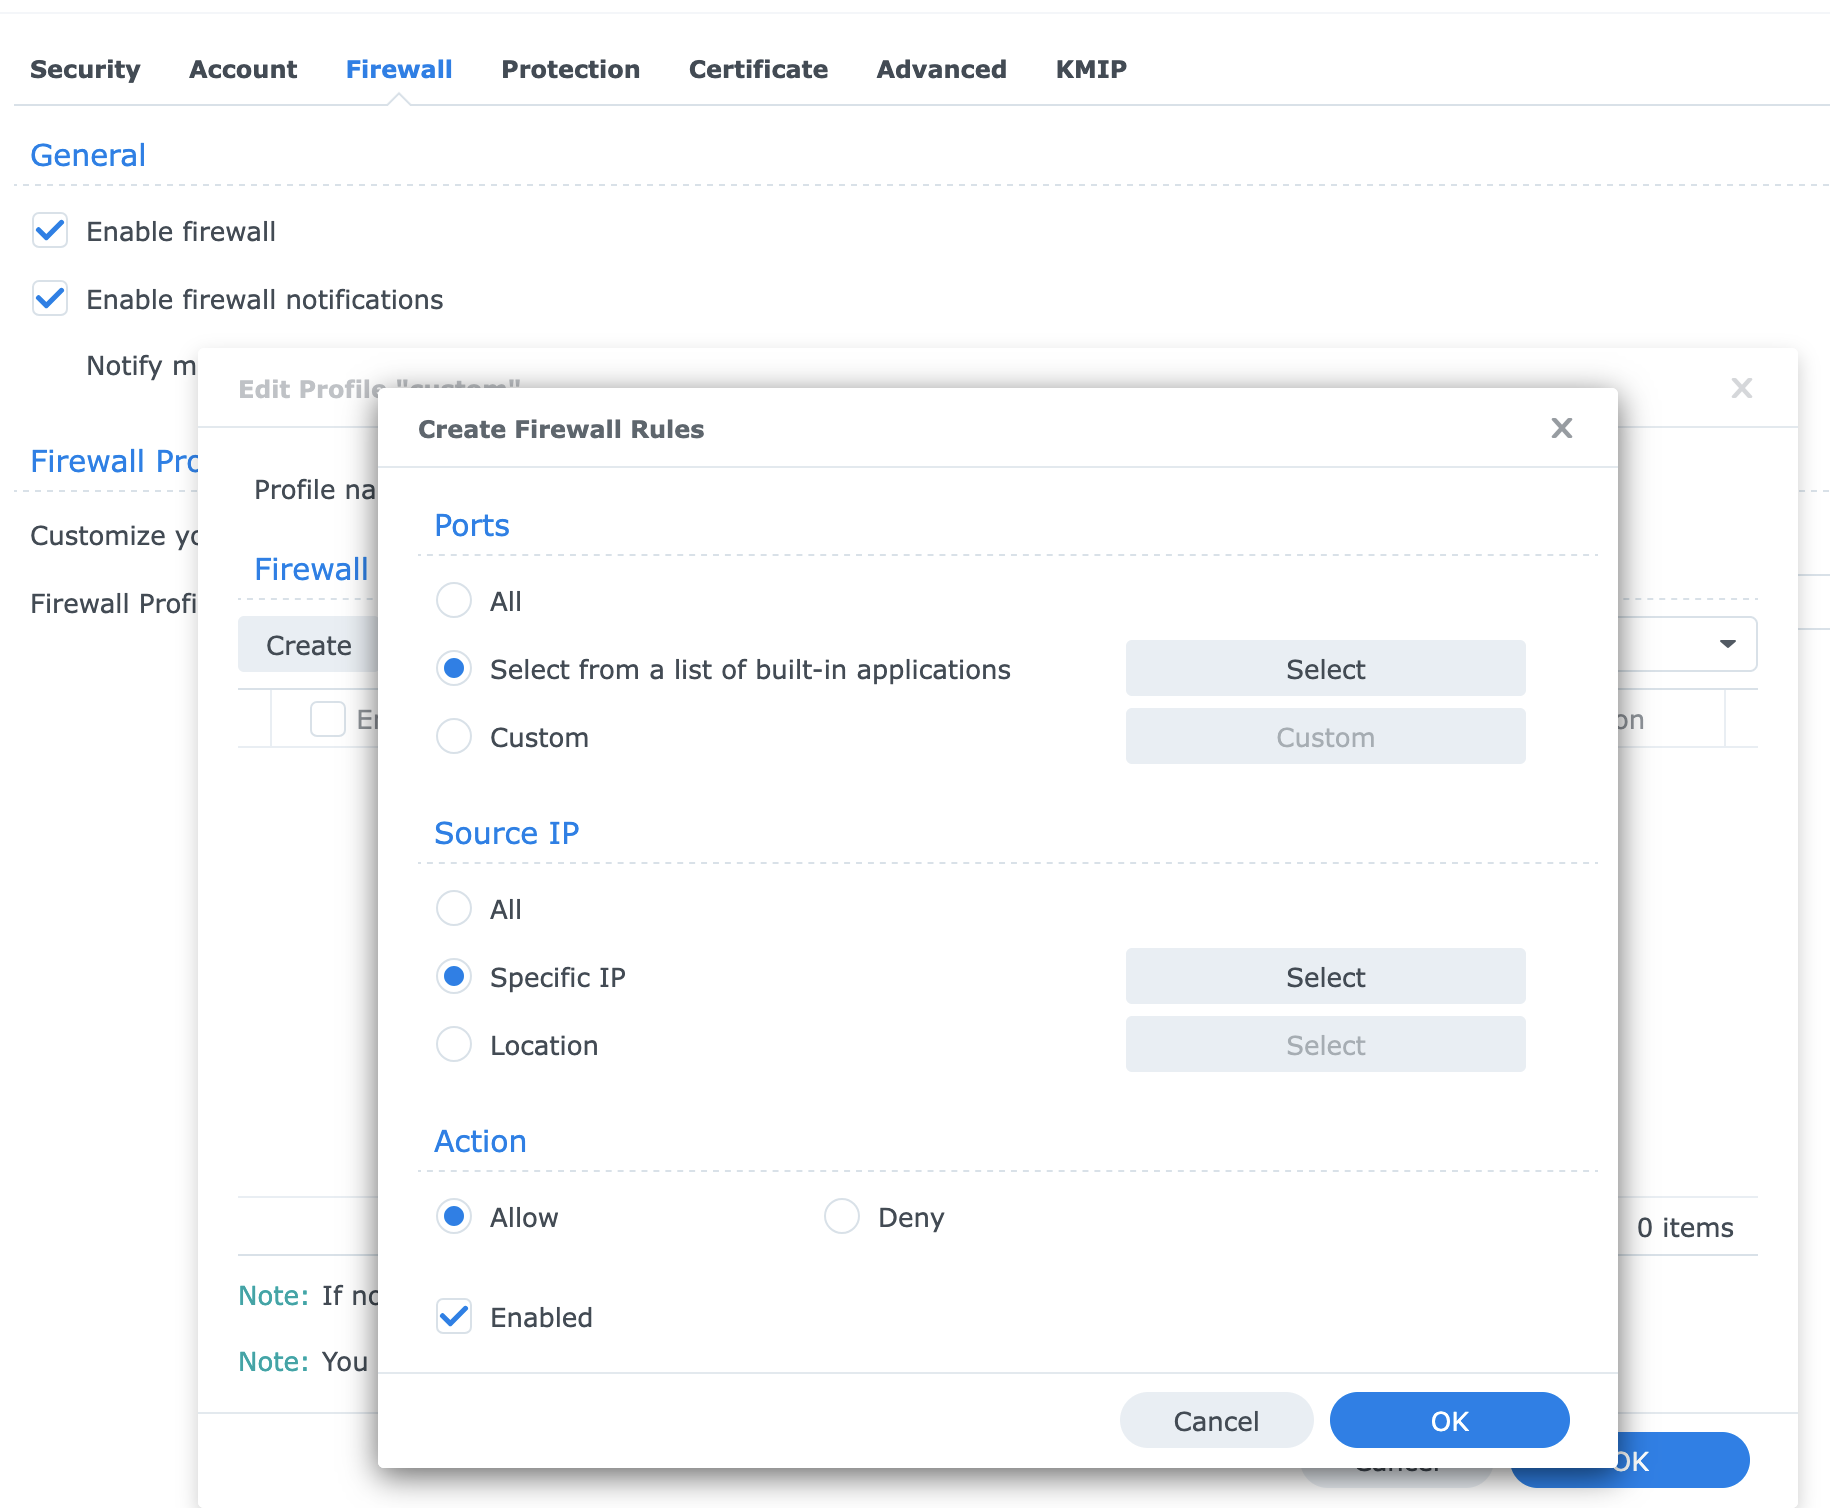
Firewall Configuration (If Enabled)
If the built in firewall is active, you’ll need to allow SNMP traffic:
- Go to Control Panel -> Security -> Firewall
- Edit your active firewall profile
- Create a new rule:
- Ports: Select from built-in applications -> SNMP service
- Source IP: Specify the IP of your monitoring server
- Action: Allow
Step 2: Prepare the SNMP Exporter Configuration
The SNMP Exporter needs a configuration file (snmp.yml) that maps Synology’s OIDs (Object Identifiers) to Prometheus metrics.
Note: This step is fairly advanced and requires knowledge of using the command-line shell on the Synology.
Prepare a generator config
Before we can map the SNMP data to Prometheus Metrics, we need to prepare a generator.yml in the current directory.
auths:
  public_v2:
    version: 2
    community: public # change this to your string

modules:
  synology:
    walk:
      - 1.3.6.1.4.1.6574
Copy Synology MIBs from your NAS:
To ensure correct data, copy the MIBs directly from your NAS (this requires command line access via ssh or the console).
# If scp fails due to Synology's SFTP chroot, force legacy scp:
# Example workflow (works even when SFTP is chrooted):
# 1) On the NAS, create a tarball:
tar czf /tmp/syno-mibs.tgz /usr/share/snmp/mibs
# 2) Copy it with legacy scp (note -O) from another system:
scp -O admin@<nas-ip>:/tmp/syno-mibs.tgz .
# 3) Extract into ./mibs:
mkdir -p mibs && tar -xzf syno-mibs.tgz -C mibs
Assuming the archive copied the structure /usr/share/snmp/mibs, running this container in the current directory will generate a new snmp.yml that will map the MIBs to Prometheus metrics.
Run this in the directory with the extracted mibs:
docker run --rm -v "$(pwd):/opt" prom/snmp-generator:latest \
  generate --no-fail-on-parse-errors \
  -g /opt/generator.yml \
  -o /opt/snmp.yml \
  -m /opt/mibs/usr/share/snmp/mibs
This container will read the generator.yml file and create a new snmp.yml file that we want to add to our SNMP exporter container below.
Step 3: Deploy with Docker Compose
This setup includes the SNMP Exporter, Prometheus, and optionally Grafana if you don’t already have it.
Create a project directory structure:
mkdir -p synology-monitoring/{prometheus,snmp}
cd synology-monitoring
Docker Compose Configuration
Create a docker-compose.yml file:
services:
  snmp-exporter:
    image: prom/snmp-exporter:latest
    container_name: snmp-exporter
    restart: unless-stopped
    ports:
      - '9116:9116'
    volumes:
      - ./snmp/snmp.yml:/etc/snmp_exporter/snmp.yml:ro
    command:
      - '--config.file=/etc/snmp_exporter/snmp.yml'
    networks:
      - monitoring

  prometheus:
    image: prom/prometheus:latest
    container_name: prometheus
    restart: unless-stopped
    ports:
      - '9090:9090'
    volumes:
      - ./prometheus/prometheus.yml:/etc/prometheus/prometheus.yml:ro
      - prometheus-data:/prometheus
    command:
      - '--config.file=/etc/prometheus/prometheus.yml'
      - '--storage.tsdb.path=/prometheus'
      - '--storage.tsdb.retention.time=30d'
      - '--web.console.libraries=/etc/prometheus/console_libraries'
      - '--web.console.templates=/etc/prometheus/consoles'
    networks:
      - monitoring
    depends_on:
      - snmp-exporter

  grafana:
    image: grafana/grafana:latest
    container_name: grafana
    restart: unless-stopped
    ports:
      - '3000:3000'
    volumes:
      - grafana-data:/var/lib/grafana
    environment:
      - GF_SECURITY_ADMIN_PASSWORD=admin
      - GF_USERS_ALLOW_SIGN_UP=false
    networks:
      - monitoring
    depends_on:
      - prometheus

volumes:
  prometheus-data:
  grafana-data:

networks:
  monitoring:
    driver: bridge
Prometheus Configuration
Create prometheus/prometheus.yml:
global:
  scrape_interval: 60s # How often to scrape targets
  evaluation_interval: 60s # How often to evaluate rules
  scrape_timeout: 30s # Timeout for each scrape

scrape_configs:
  # Prometheus self-monitoring
  - job_name: 'prometheus'
    static_configs:
      - targets: ['localhost:9090']

  # Synology NAS via SNMP
  - job_name: 'synology-snmp'
    scrape_interval: 120s # Scrape less frequently to reduce load
    scrape_timeout: 60s
    static_configs:
      - targets:
          - 192.168.1.100 # Replace with your NAS IP
    metrics_path: /snmp
    params:
      module: [synology] # Must match module name in snmp.yml
    relabel_configs:
      # Set the target parameter for SNMP exporter
      - source_labels: [__address__]
        target_label: __param_target

      # Use the target as the instance label
      - source_labels: [__param_target]
        target_label: instance

      # Point to the SNMP exporter
      - target_label: __address__
        replacement: snmp-exporter:9116
Understanding the Relabel Configuration
The relabel_configs section might look mysterious, but it’s crucial for SNMP monitoring:
- First rule: Takes the NAS IP from
targetsand sets it as__param_target, which becomes the?target=URL parameter - Second rule: Copies that target to the
instancelabel so your metrics show the NAS IP instead of the exporter’s IP - Third rule: Redirects Prometheus to scrape the SNMP Exporter instead of the NAS directly
Without these, Prometheus would try to scrape your NAS directly, which won’t work.
Directory Structure
Your final structure should look like:
synology-monitoring/
├── docker-compose.yml
├── prometheus/
│   └── prometheus.yml
└── snmp/
    └── snmp.yml
Step 4: Launch and Verify
Start the monitoring stack:
docker compose up -dCheck that all containers are running:
docker compose psYou should see three containers in the “Up” state.
Verify SNMP Exporter
Test the SNMP Exporter directly:
curl "http://localhost:9116/snmp?target=192.168.1.100&module=synology"You should see a lot of Prometheus metrics. Look for Synology-specific ones like:
# HELP cpuFanStatus Synology cpu fan status Each meanings of status represented describe below - 1.3.6.1.4.1.6574.1.4.2
# TYPE cpuFanStatus gauge
cpuFanStatus 1
# HELP cpuUtilization This oid is CPU utilization. - 1.3.6.1.4.1.6574.1.7.1
# TYPE cpuUtilization gauge
cpuUtilization 0
# HELP diskBadSector Synology disk bad sector count The count of each disk I/O bad sector. - 1.3.6.1.4.1.6574.2.1.1.9
# TYPE diskBadSector gauge
diskBadSector{diskIndex="0"} 0
diskBadSector{diskIndex="1"} 0
diskBadSector{diskIndex="2"} 0
diskBadSector{diskIndex="3"} 0
# HELP diskHealthStatus Synology disk health status Each meanings of status represented describe below - 1.3.6.1.4.1.6574.2.1.1.13
# TYPE diskHealthStatus gauge
diskHealthStatus{diskIndex="0"} 1
diskHealthStatus{diskIndex="1"} 1
diskHealthStatus{diskIndex="2"} 1
diskHealthStatus{diskIndex="3"} 1
# HELP diskID Synology disk ID The ID of disk is assigned by disk Station. - 1.3.6.1.4.1.6574.2.1.1.2
# TYPE diskID gauge
diskID{diskID="0x4469736B2031",diskIndex="0"} 1
diskID{diskID="0x4469736B2032",diskIndex="1"} 1
diskID{diskID="0x4469736B2033",diskIndex="2"} 1
diskID{diskID="0x4469736B2034",diskIndex="3"} 1
# HELP diskIdentifyFail Synology disk identify fail count The count of each disk identify fails. - 1.3.6.1.4.1.6574.2.1.1.10
# TYPE diskIdentifyFail gauge
diskIdentifyFail{diskIndex="0"} 0
diskIdentifyFail{diskIndex="1"} 0
diskIdentifyFail{diskIndex="2"} 0
diskIdentifyFail{diskIndex="3"} 0
Verify Prometheus
- Open Prometheus:
http://localhost:9090 - Go to Status -> Target Health
- Confirm the
synology-snmptarget shows as “UP”
Try querying some metrics in the Prometheus web console:
temperature- System temperaturediskTemperature- Individual disk temperatures by disk indexraidStatus- RAID health status
Step 5: Import the Grafana Dashboard
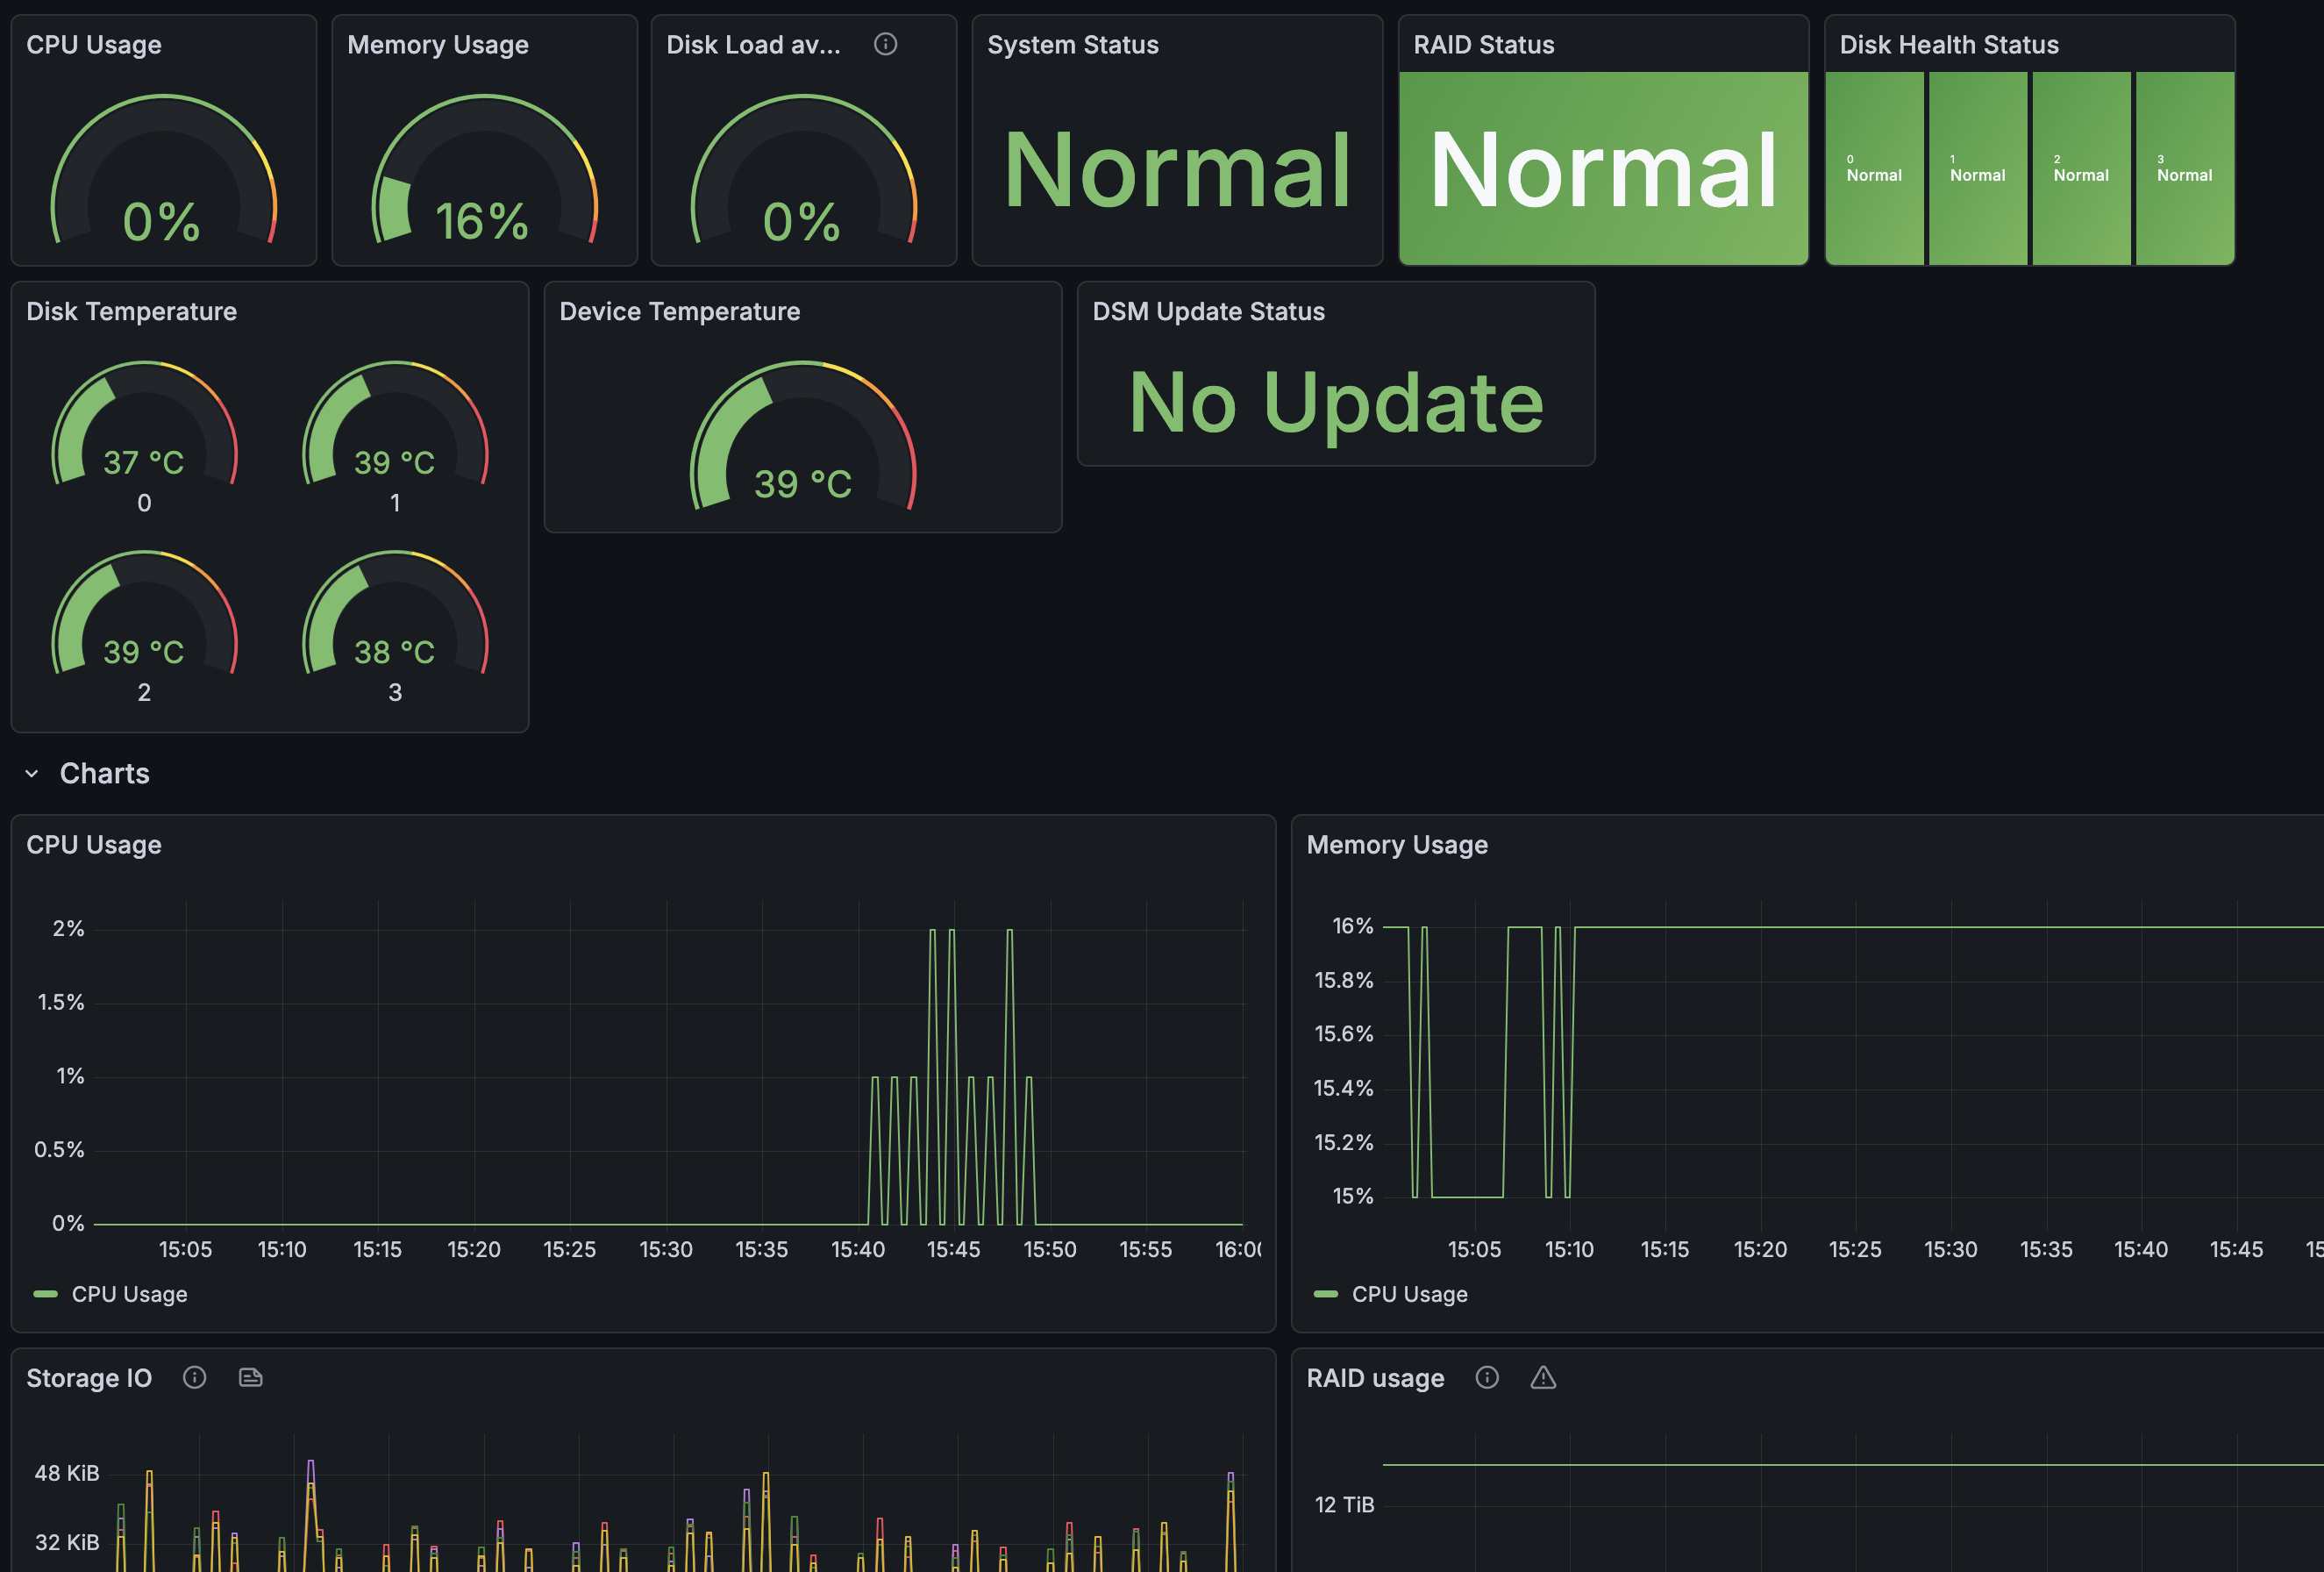
Grafana can be used to visualize metrics. I have created a dashboard using the metrics collected by Prometheus.
- Open Grafana:
http://localhost:3000 - Default login:
admin/admin(change this) - Add Prometheus as a data source:
- Connections -> Data Sources -> Add new data source
- Select Prometheus
- URL:
http://prometheus:9090 - Click Save & Test
Import the Dashboard
This is a dashboard I created and for now it is just the basics. I would like to improve the RAID metrics but there are a lot of parameters to go through so I have put that task on the backlog.
The Dashboard file is on my GitHub repo along with other Grafana dashboards I have created. https://github.com/acaylor/grafana/raw/refs/heads/main/grafana/provisioning/dashboards/synology-snmp.json
- Go to Dashboards -> Import
- Load from JSON file
- Click Load
- Select your Prometheus data source
- Click Import
What You’ll See
Troubleshooting Common Issues
SNMP Exporter Shows No Data
Check SNMP connectivity:
# Install snmpwalk tool
sudo apt install snmp

# Test SNMP directly
snmpwalk -v2c -c your_community_string 192.168.1.100
If this fails, verify:
- SNMP service is enabled on Synology
- Firewall allows UDP port 161
- Community string matches
Metrics Missing or Incorrect
DisplayString issues on DSM 7.x:
If you see hex values instead of readable strings for serial numbers or disk IDs, your snmp.yml needs these OIDs set as type: DisplayString:
- name: serialNumber
  oid: 1.3.6.1.4.1.6574.1.5.2
  type: DisplayString

- name: version
  oid: 1.3.6.1.4.1.6574.1.5.3
  type: DisplayString

- name: diskID
  oid: 1.3.6.1.4.1.6574.2.1.1.2
  type: DisplayString
Context Deadline Exceeded
If Prometheus shows timeouts:
- Increase
scrape_timeoutin Prometheus config (try 60s) - Reduce
scrape_interval(try 120s or 300s) - Check network latency between Prometheus and NAS
Dashboard Panels Show “No Data”
- Verify the job name matches in your Prometheus config and dashboard queries
- Check that metrics are actually present in Prometheus: Status -> TSDB Status
- Ensure the time range in Grafana covers when metrics started being collected
Performance Considerations
Scrape Frequency
SNMP queries can generate load on your NAS. Consider scraping no more than once per minute.
Resource Usage
Typical resource consumption:
| Component | CPU cores | Memory | Storage |
|---|---|---|---|
| SNMP Exporter | <5% | ~50MB | Minimal |
| Prometheus (30 days) | ~10% | ~500MB | ~5GB |
| Grafana | ~5% | ~200MB | ~1GB |
Next Steps
- Explore Synology MIBs: Dive into the official MIB guide to find additional metrics.
- Add Alerting: Configure Prometheus Alertmanager for email/Slack notifications.
- Create Custom Dashboards: Build dashboards specific to your use case.
- Monitor Other Devices: Use the same SNMP Exporter setup for network switches, UPS units, and other SNMP-capable hardware.
Resources
New disclaimer I am adding: I used an LLM to help create this post but afterwards I spent more than an hour editing it to the final form.