Monitoring Proxmox hosts with Grafana Alloy
Last year I wrote about monitoring Debian with Grafana Alloy as a native package instead of a Docker container. Only one of my Proxmox nodes actually had it installed, and its config had drifted from the conventions the rest of my lab uses. This week I cleaned up that config, rolled it out to all five nodes, and added metrics for disk health, pending updates, failed services, ZFS scrubs, and WireGuard peers.
The goals
- One config for every node. Nothing host-specific in the file, so the same copy works everywhere.
- Packages only. Alloy from Grafana’s apt repository, and the extra collectors from Debian’s. Normal
apt upgraderuns keep everything current. - No separate node_exporter. Alloy has node_exporter built in (
prometheus.exporter.unix), and it pushes metrics to Prometheus withremote_writeinstead of being scraped.
Every host attaches the same labels to its metrics and logs:
hostandinstanceare both set to the machine’s short hostname (constants.hostname), which is what my dashboards filter on.jobfollows Alloy’sintegrations/*names.collector="alloy"is added to logs only, because node_exporter already usescollectorfor its own sub-collectors.
How it flows

Each node runs two pipelines in one Alloy process:
- Metrics: Alloy’s built-in node_exporter reads the kernel’s stats, the state of selected systemd units over D-Bus, and the
.promfiles that Debian’s collector timers write. Alloy scrapes its own exporter every 30 seconds and pushes the results to Prometheus withremote_write. - Logs: Alloy reads the systemd journal and three Proxmox log files that never reach the journal, and pushes them to Loki.
The diagram source is alloy-proxmox.d2.
What was wrong with the old config
The config on my first node worked, but it predated those conventions:
- No
hostlabel, so that node’s metrics and logs didn’t appear when I filtered by host. - It tailed
/var/log/**/*.log. On Proxmox,ifupdown2writes a new debug log every time the network config reloads, so Alloy kept picking up new files. Almost everything else on Proxmox 9 already goes to the journal. - It collected every network interface. Proxmox creates
tap,veth, andfwbr/fwpr/fwlninterfaces for each guest, so every VM start or migration created new series.pve-exporteralready reports per-guest traffic. - It logged a usage-reporting warning every four hours. Alloy sends anonymous usage stats to
stats.grafana.org, which my AdGuard blocks.--disable-reportingturns that off.
Install
On each Proxmox node, as root:
# Grafana's apt repository
install -d -m 0755 /etc/apt/keyrings
wget -qO- https://apt.grafana.com/gpg.key | gpg --dearmor > /etc/apt/keyrings/grafana.gpg
echo "deb [signed-by=/etc/apt/keyrings/grafana.gpg] https://apt.grafana.com stable main" \
  > /etc/apt/sources.list.d/grafana.list
apt-get update

# Alloy plus Debian's textfile collector scripts (add nvme-cli on NVMe machines)
apt-get install -y --no-install-recommends alloy prometheus-node-exporter-collectors

# The directory the collector timers write to
echo "d /var/lib/prometheus/node-exporter 0755 root root -" > /etc/tmpfiles.d/node-exporter-textfile.conf
systemd-tmpfiles --create /etc/tmpfiles.d/node-exporter-textfile.conf
systemctl start prometheus-node-exporter-smartmon.service prometheus-node-exporter-apt.service
Don’t skip the tmpfiles.d step: prometheus-node-exporter-collectors writes .prom files to /var/lib/prometheus/node-exporter/, which on Debian 13 is only created by the prometheus-node-exporter package. Because Alloy replaces node_exporter, the collector timers fail until that directory exists.
Then copy the config (below) to /etc/alloy/config.alloy, set the arguments in /etc/default/alloy, and start Alloy:
sed -i 's|^CUSTOM_ARGS=.*|CUSTOM_ARGS="--server.http.listen-addr=0.0.0.0:12345 --disable-reporting"|' /etc/default/alloy
alloy validate /etc/alloy/config.alloy
systemctl enable --now alloy
alloy validate checks the whole config without starting anything.
New metrics from Debian’s collectors
prometheus-node-exporter-collectors ships small scripts run by systemd timers, and Alloy’s textfile collector reads the .prom files they write. Three are useful on my hardware:
| Timer | File | What it reports |
|---|---|---|
smartmon |
smartmon.prom |
SMART health and attributes per disk: temperature, reallocated and pending sectors, SSD wear |
nvme |
nvme.prom |
NVMe health, wear, temperature, and media errors. Needs nvme-cli |
apt |
apt.prom |
Pending upgrades by origin, packages to autoremove, cache age, and node_reboot_required |
The package also enables IPMI and Mellanox timers, but their systemd Condition* checks skip them when that hardware isn’t present, so they never show up as failed units.
Watching important services
node_exporter’s systemd collector reports the state of each unit. Collecting every unit would add a lot of series for little benefit, so I limit unit_include (shown in the full config below) to the ones I’d want an alert for. pve-guests is a oneshot that starts VMs at boot, so a failed state there means some guests didn’t come back after a reboot. The collector timers’ own services are included too, so a broken collector shows up.
Logs
Alloy reads the systemd journal, plus three Proxmox logs that only exist as files: pve-firewall.log, pveam.log, and apt/history.log. I skip pveproxy/access.log, which is mostly API polling from pve-exporter.
Proxmox 9 has no /var/log/auth.log. Debian 13 doesn’t install rsyslog, so SSH, PAM, and sudo messages only exist in the journal. They still reach Loki, under unit="ssh.service":
{host="hp01", unit="ssh.service"} |= "Accepted"Every SSH login used to create a new Loki stream. After login, sudo and PAM messages are logged under a per-session unit like session-71.scope, which the journal relabeling copies into the unit label. One extra relabel rule collapses those into session.scope.
The full config
Every node gets this exact /etc/alloy/config.alloy:
// Grafana Alloy for Proxmox VE hosts (native .deb install).
// Identical on every node: the host name comes from constants.hostname,
// so copy this file unchanged to /etc/alloy/config.alloy.

logging {
  level  = "info"
  format = "logfmt"
}

// =============================================================================
// METRICS
// =============================================================================

prometheus.exporter.unix "integrations_node_exporter" {
  // No ZFS on the hosts themselves; re-enable "zfs" if a node has a pool.
  disable_collectors = ["ipvs", "btrfs", "infiniband", "xfs", "zfs"]
  enable_collectors  = ["meminfo", "systemd"]

  // .prom files written by the Debian prometheus-node-exporter-collectors timers:
  // smartmon (SMART), apt (pending upgrades, reboot required), nvme (when nvme-cli exists).
  textfile {
    directory = "/var/lib/prometheus/node-exporter"
  }

  // Only the units worth alerting on (node_systemd_unit_state{state="failed"} == 1).
  // Units that don't exist on a node are simply absent.
  systemd {
    unit_include = "(pve-cluster|corosync|pvedaemon|pveproxy|pvestatd|pvescheduler|pve-firewall|proxmox-firewall|pve-ha-lrm|pve-ha-crm|pve-guests|pve-daily-update|qmeventd|watchdog-mux|chrony|ssh|smartmontools|apcupsd|apcupsd_exporter|alloy|prometheus-node-exporter-.+)\\.service"
  }

  filesystem {
    fs_types_exclude     = "^(autofs|binfmt_misc|bpf|cgroup2?|configfs|debugfs|devpts|devtmpfs|tmpfs|fusectl|hugetlbfs|iso9660|mqueue|nsfs|overlay|proc|procfs|pstore|rpc_pipefs|securityfs|selinuxfs|squashfs|sysfs|tracefs)$"
    mount_points_exclude = "^/(dev|proc|run/credentials/.+|sys|var/lib/docker/.+)($|/)"
    mount_timeout        = "5s"
  }

  // Skip per-guest Proxmox interfaces (tap = VM NIC, veth = LXC NIC, fw* = firewall
  // bridges). They churn on every guest start/migrate; pve-exporter already
  // reports per-guest traffic.
  netclass {
    ignored_devices = "^(veth.*|tap.*|fwbr.*|fwpr.*|fwln.*|cali.*|[a-f0-9]{15})$"
  }

  netdev {
    device_exclude = "^(veth.*|tap.*|fwbr.*|fwpr.*|fwln.*|cali.*|[a-f0-9]{15})$"
  }
}

discovery.relabel "integrations_node_exporter" {
  targets = prometheus.exporter.unix.integrations_node_exporter.targets

  rule {
    target_label = "instance"
    replacement  = constants.hostname
  }

  rule {
    target_label = "job"
    replacement  = "integrations/node_exporter"
  }
}

prometheus.scrape "integrations_node_exporter" {
  scrape_interval = "30s"
  targets         = discovery.relabel.integrations_node_exporter.output
  forward_to      = [prometheus.remote_write.to_prom.receiver]
}

// Alloy's own metrics
prometheus.exporter.self "integrations_alloy_health" { }

discovery.relabel "integrations_alloy_health" {
  targets = prometheus.exporter.self.integrations_alloy_health.targets

  rule {
    target_label = "instance"
    replacement  = constants.hostname
  }
}

prometheus.scrape "integrations_alloy_health" {
  targets    = discovery.relabel.integrations_alloy_health.output
  forward_to = [prometheus.remote_write.to_prom.receiver]
  job_name   = "integrations/alloy"
}

prometheus.remote_write "to_prom" {
  // no collector label here: it collides with node_exporter's own collector label
  external_labels = {
    host = constants.hostname,
  }

  endpoint {
    url = "https://prometheus.example.com/api/v1/write"
  }
}

// =============================================================================
// LOGS
// =============================================================================

discovery.relabel "log_collection_journal_scrape" {
  targets = []

  rule {
    source_labels = ["__journal__systemd_unit"]
    target_label  = "unit"
  }

  // Collapse per-login session-NN.scope units into one stream (sudo/PAM lines
  // after login land there); otherwise every SSH login creates a new Loki stream.
  rule {
    source_labels = ["unit"]
    regex         = "session-[0-9]+\\.scope"
    target_label  = "unit"
    replacement   = "session.scope"
  }

  rule {
    source_labels = ["__journal__boot_id"]
    target_label  = "boot_id"
  }

  rule {
    source_labels = ["__journal__transport"]
    target_label  = "transport"
  }

  rule {
    source_labels = ["__journal_priority_keyword"]
    target_label  = "level"
  }

  rule {
    target_label = "instance"
    replacement  = constants.hostname
  }

  rule {
    target_label = "job"
    replacement  = "integrations/systemd_journal"
  }
}

loki.source.journal "system_logs" {
  max_age       = "24h0m0s"
  relabel_rules = discovery.relabel.log_collection_journal_scrape.rules
  forward_to    = [loki.write.default.receiver]
}

// Proxmox logs that are written to files only (everything else is in the journal).
// pveproxy/access.log is deliberately excluded: megabytes a day of API polling.
local.file_match "pve_logs" {
  path_targets = [
    {__path__ = "/var/log/pve-firewall.log", instance = constants.hostname, job = "varlogs"},
    {__path__ = "/var/log/pveam.log",        instance = constants.hostname, job = "varlogs"},
    {__path__ = "/var/log/apt/history.log",  instance = constants.hostname, job = "varlogs"},
  ]
}

loki.source.file "pve_logs" {
  targets    = local.file_match.pve_logs.targets
  forward_to = [loki.write.default.receiver]
}

loki.write "default" {
  external_labels = {
    host      = constants.hostname,
    collector = "alloy",
  }

  endpoint {
    url = "https://loki.example.com/loki/api/v1/push"
  }
}
VM-specific collectors
Two VMs run the same base Alloy config with extra collectors for their roles.
ZFS on the backup NAS
My backup NAS is an Ubuntu 24.04 VM with a two-disk ZFS mirror passed through from its Proxmox host (Proxmox NAS VM). For that VM:
- I turned on Alloy’s
zfscollector, which gives ARC stats andnode_zfs_zpool_state. - I added the packaged
zfs_zpool.shscript for pool health, size, free space, and fragmentation. - I disabled the
smartmontimer. The VM sees QEMU virtual disks, so SMART data comes from the Proxmox host instead.
Nothing packaged reports when the last scrub ran or the per-disk error counters, and those are what I most want to know about a backup pool. ZFS 2.3 added zpool status -j for JSON output, but Ubuntu 24.04 ships ZFS 2.2, so I wrote a small script that parses the text output:
#!/bin/bash
# Scrub and vdev error metrics from `zpool status -p` for the node_exporter textfile collector.
# Complements zfs_zpool.sh (capacity, health) from prometheus-node-exporter-collectors.
# ZFS 2.2 (Ubuntu 24.04) has no `zpool status -j`, so this parses the text output.
set -euo pipefail

echo "# HELP zfs_zpool_scrub_end_timestamp_seconds When the last completed scrub finished (absent if none ever ran)."
echo "# TYPE zfs_zpool_scrub_end_timestamp_seconds gauge"
echo "# HELP zfs_zpool_scrub_errors Errors found by the last completed scrub."
echo "# TYPE zfs_zpool_scrub_errors gauge"
echo "# HELP zfs_zpool_scrub_repaired_bytes Bytes repaired by the last completed scrub."
echo "# TYPE zfs_zpool_scrub_repaired_bytes gauge"
echo "# HELP zfs_zpool_scan_in_progress 1 while a scrub or resilver is running."
echo "# TYPE zfs_zpool_scan_in_progress gauge"
echo "# HELP zfs_zpool_data_errors Permanent data errors reported on the errors: line."
echo "# TYPE zfs_zpool_data_errors gauge"
echo "# HELP zfs_vdev_errors Read, write, and checksum error counters per vdev since import or clear."
echo "# TYPE zfs_vdev_errors gauge"
echo "# HELP zfs_vdev_state Constant 1 with the vdev state as a label."
echo "# TYPE zfs_vdev_state gauge"

zpool list -H -o name | while read -r pool; do
  status="$(zpool status -p "$pool")"

  scan="$(printf '%s\n' "$status" | sed -n 's/^ *scan: //p')"
  if printf '%s' "$scan" | grep -Eq 'in progress'; then
    echo "zfs_zpool_scan_in_progress{zpool_name=\"$pool\"} 1"
  else
    echo "zfs_zpool_scan_in_progress{zpool_name=\"$pool\"} 0"
  fi
  # e.g. "scrub repaired 0B in 04:00:18 with 0 errors on Sun Nov  8 04:24:20 2026"
  if [[ "$scan" =~ ^scrub\ repaired\ ([0-9]+)B?\ in\ .*\ with\ ([0-9]+)\ errors\ on\ (.+)$ ]]; then
    end="$(date -d "${BASH_REMATCH[3]}" +%s)"
    echo "zfs_zpool_scrub_end_timestamp_seconds{zpool_name=\"$pool\"} $end"
    echo "zfs_zpool_scrub_errors{zpool_name=\"$pool\"} ${BASH_REMATCH[2]}"
    echo "zfs_zpool_scrub_repaired_bytes{zpool_name=\"$pool\"} ${BASH_REMATCH[1]}"
  fi

  errline="$(printf '%s\n' "$status" | sed -n 's/^errors: //p')"
  if [[ "$errline" == "No known data errors" ]]; then
    echo "zfs_zpool_data_errors{zpool_name=\"$pool\"} 0"
  elif [[ "$errline" =~ ^([0-9]+)\ data\ errors ]]; then
    echo "zfs_zpool_data_errors{zpool_name=\"$pool\"} ${BASH_REMATCH[1]}"
  fi

  # config table: NAME STATE READ WRITE CKSUM, between "config:" and "errors:"
  printf '%s\n' "$status" | awk -v pool="$pool" '
    /^config:/ {in_cfg=1; next}
    /^errors:/ {in_cfg=0}
    in_cfg && $1 != "NAME" && NF >= 5 && $3 ~ /^[0-9]+$/ && $4 ~ /^[0-9]+$/ && $5 ~ /^[0-9]+$/ {
      printf "zfs_vdev_state{zpool_name=\"%s\",vdev=\"%s\",state=\"%s\"} 1\n", pool, $1, $2
      printf "zfs_vdev_errors{zpool_name=\"%s\",vdev=\"%s\",type=\"read\"} %s\n", pool, $1, $3
      printf "zfs_vdev_errors{zpool_name=\"%s\",vdev=\"%s\",type=\"write\"} %s\n", pool, $1, $4
      printf "zfs_vdev_errors{zpool_name=\"%s\",vdev=\"%s\",type=\"checksum\"} %s\n", pool, $1, $5
    }'
done
A oneshot service and timer run both ZFS scripts every 5 minutes:
# /etc/systemd/system/prometheus-node-exporter-zfs.service
[Unit]
Description=Collect ZFS pool metrics for the node_exporter textfile collector
ConditionPathExists=/proc/spl/kstat/zfs

[Service]
Type=oneshot
Environment=TMPDIR=/var/lib/prometheus/node-exporter
ExecStart=/bin/bash -o pipefail -c "/bin/bash /usr/share/prometheus-node-exporter-collectors/zfs_zpool.sh | sponge /var/lib/prometheus/node-exporter/zfs_zpool.prom"
ExecStart=/bin/bash -o pipefail -c "/usr/local/sbin/zpool_status.sh | sponge /var/lib/prometheus/node-exporter/zpool_status.prom"
# /etc/systemd/system/prometheus-node-exporter-zfs.timer
[Unit]
Description=Run ZFS pool metrics collection every 5 minutes
[Timer]
OnBootSec=1min
OnUnitActiveSec=5min
[Install]
WantedBy=timers.targetsponge (from moreutils) writes the file in one step, so Alloy never reads a half-written .prom file.
Ubuntu 24.04 caught me out twice:
- Its
prometheus-node-exporter-collectorspackage hard-depends onprometheus-node-exporter(Debian 13’s and Ubuntu 26.04’s don’t). Installing the collectors started a standalonenode_exporteron port 9100 alongside Alloy. Becauseaptwon’t removeprometheus-node-exporterwithout removing the collectors too, I masked the service:systemctl mask --now prometheus-node-exporter.service. - Ubuntu 24.04’s
/bin/sh(dash) doesn’t support-o pipefail. Newer dash does, which is why the packaged units work on Debian 13. My unit uses/bin/bashexplicitly.
WireGuard peers
My WireGuard server is an Ubuntu 26.04 VM with 1 GB of RAM. Alloy runs there with a systemd drop-in that caps its memory (GOMEMLIMIT=100MiB, MemoryMax=256M), and it uses about 60 MiB. Its service list swaps the Proxmox units for wg-quick@.+, systemd-resolved, and chrony.
Ubuntu 26.04 doesn’t package a WireGuard exporter, so a 1-minute systemd timer runs a small script that formats wg show <interface> dump for the textfile collector. Each peer gets its peer label from the # name comment in its [Peer] block, and the script exports only public keys, never preshared keys or client endpoint IPs.
#!/bin/bash
# WireGuard per-peer metrics for the node_exporter textfile collector.
# Peer names come from the "# <name>" comment inside each [Peer] block of
# /etc/wireguard/<interface>.conf. No exporter is packaged for Ubuntu 26.04.
set -euo pipefail

echo "# HELP wireguard_peer_info Constant 1 per configured peer."
echo "# TYPE wireguard_peer_info gauge"
echo "# HELP wireguard_peer_latest_handshake_seconds Unix time of the peer's latest handshake (0 = none since the interface came up)."
echo "# TYPE wireguard_peer_latest_handshake_seconds gauge"
echo "# HELP wireguard_peer_receive_bytes_total Bytes received from the peer since the interface came up."
echo "# TYPE wireguard_peer_receive_bytes_total counter"
echo "# HELP wireguard_peer_transmit_bytes_total Bytes sent to the peer since the interface came up."
echo "# TYPE wireguard_peer_transmit_bytes_total counter"
echo "# HELP wireguard_interface_up_since_seconds Unix time the interface's wg-quick unit last started."
echo "# TYPE wireguard_interface_up_since_seconds gauge"

for iface in $(wg show interfaces); do
  conf="/etc/wireguard/${iface}.conf"

  # public key -> name, from "# name" comments in [Peer] blocks
  declare -A names=()
  if [[ -r "$conf" ]]; then
    while IFS=' ' read -r key name; do
      names["$key"]="$name"
    done < <(awk '
      /^\[Peer\]/ {in_peer=1; name=""; next}
      /^\[/       {in_peer=0}
      in_peer && /^#/ && name == "" {sub(/^#[ \t]*/, ""); gsub(/[ \t"\\]+/, "_"); name=$0}
      in_peer && /^PublicKey/ {sub(/^PublicKey[ \t]*=[ \t]*/, ""); print $0, (name == "" ? "unnamed" : name)}
    ' "$conf")
  fi

  since="$(systemctl show "wg-quick@${iface}.service" -p ActiveEnterTimestamp --value 2>/dev/null || true)"
  if [[ -n "$since" ]]; then
    echo "wireguard_interface_up_since_seconds{interface=\"$iface\"} $(date -d "$since" +%s)"
  fi

  # dump peer lines: public-key preshared-key endpoint allowed-ips latest-handshake rx tx keepalive
  wg show "$iface" dump | tail -n +2 | while IFS=$'\t' read -r pub _psk _endpoint allowed hs rx tx _ka; do
    name="${names[$pub]:-unnamed}"
    labels="interface=\"$iface\",peer=\"$name\",allowed_ips=\"$allowed\""
    echo "wireguard_peer_info{${labels},public_key=\"$pub\"} 1"
    echo "wireguard_peer_latest_handshake_seconds{${labels}} $hs"
    echo "wireguard_peer_receive_bytes_total{${labels}} $rx"
    echo "wireguard_peer_transmit_bytes_total{${labels}} $tx"
  done
  unset names
done
Queries for Grafana
Some queries I use, and that I’ll turn into alerts:
# disks
smartmon_device_smart_healthy == 0
max by (host, disk) (smartmon_temperature_celsius_raw_value)
smartmon_reallocated_sector_ct_raw_value > 0 or smartmon_current_pending_sector_raw_value > 0
nvme_critical_warning > 0 or nvme_media_errors_total > 0

# updates
sum by (host) (apt_upgrades_pending)
node_reboot_required == 1

# services
node_systemd_unit_state{state="failed"} == 1

# ZFS
node_zfs_zpool_state{state!="online"} == 1
(time() - zfs_zpool_scrub_end_timestamp_seconds) / 86400 > 35
zfs_vdev_errors > 0 or zfs_zpool_data_errors > 0
1 - zfs_zpool_free_bytes / zfs_zpool_size_bytes

# WireGuard: hours since each peer's last handshake
(time() - wireguard_peer_latest_handshake_seconds) / 3600 and wireguard_peer_latest_handshake_seconds > 0
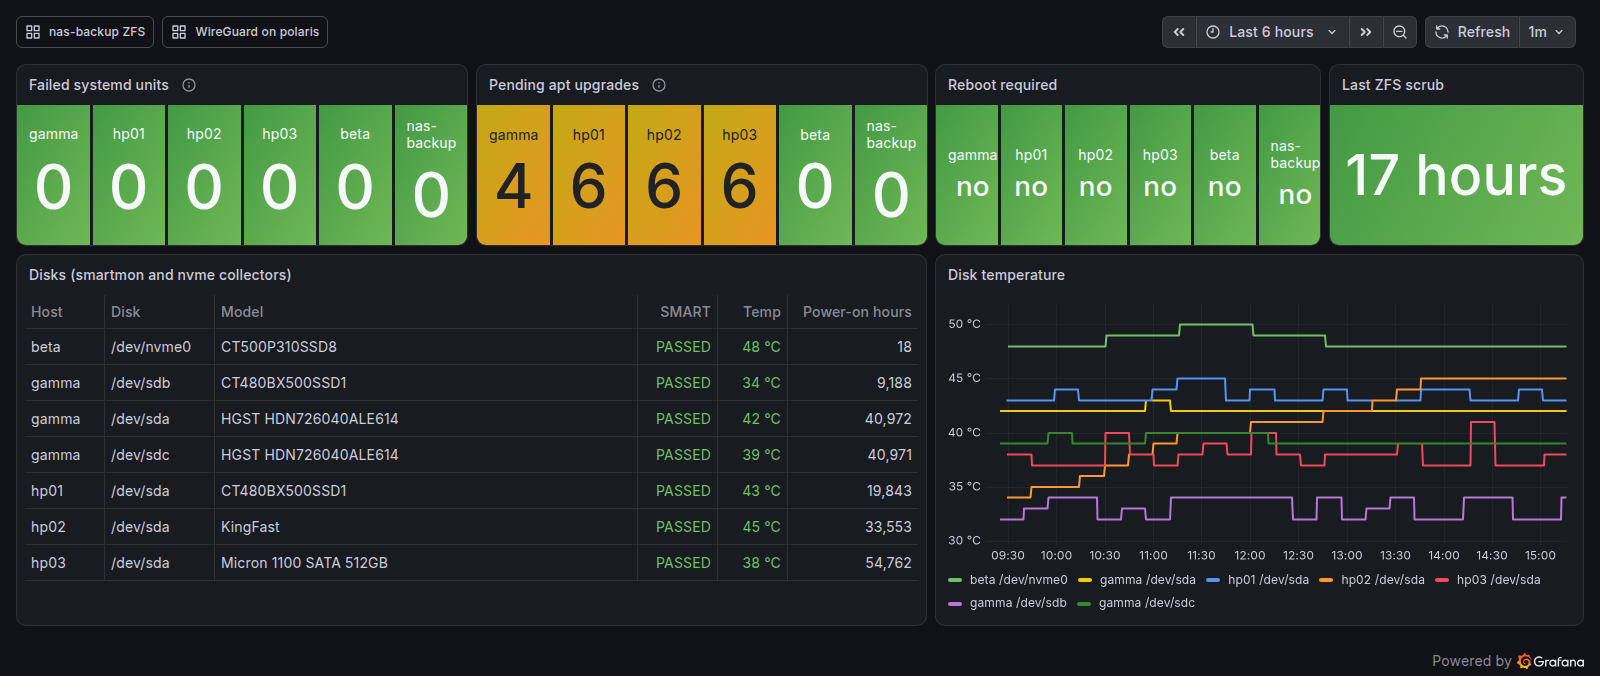
After the rollout, all five Proxmox nodes reported healthy disks and no failed services. The NAS pool was online and half full, and its monthly scrub that morning had found no errors. Here is the Grafana dashboard built from these queries, a few hours after the rollout:
What’s next
Nothing in my lab sends notifications yet. The next step is moving Prometheus and Loki into my k3s cluster and adding alerts for failures that need attention: a failing disk, scrub errors, a failed service, or a host that stops reporting.