This week in the homelab- November 14, 2026
Last week was about moving everything off two Raspberry Pis. This week was quieter: adding a fifth Proxmox node and getting every Proxmox host, the backup NAS, and the WireGuard VM reporting the same metrics and logs.
A fifth Proxmox node
I added beta, a small AZW (Beelink) SER mini PC with a Ryzen 7 7735U, and gave it the IP address the retired pi.hole used to have.
The cluster now looks like this:
| Node | Hardware | Guests |
|---|---|---|
gamma |
Ryzen desktop | rigel, polaris, nas-backup, a k3s worker |
hp01 |
HP mini desktop | a k3s control-plane node and a worker |
hp02 |
HP mini desktop | a k3s control-plane node and a worker |
hp03 |
HP mini desktop | vega, blackhole, a k3s control-plane node and a worker |
beta |
Ryzen 7 mini PC | none yet |
I created a new diagram of the whole lab in Homelab diagram, November 2026.
Certificate renewal
I renewed the *.lan wildcard certificate that Caddy serves on rigel and vega a few days before its November 11 expiry. It mattered more than usual this time: Loki and Prometheus sit behind that certificate, so every host’s HTTPS log and metric pushes would have started failing when it expired.
One Alloy config for every Proxmox host
Only one of my Proxmox hosts, gamma, had Grafana Alloy installed. Its config predated the label conventions I settled on during the Pi migration, so I audited it before copying it anywhere:
- Its metrics and logs had no
hostlabel, so filtering dashboards by host found nothing. - It tailed every
*.logfile under/var/log, which picked up a new debug log every time the network config reloaded. - It collected stats for every guest’s virtual network interfaces, which come and go as VMs start and stop.
- Its usage reporting to Grafana failed every few hours because AdGuard blocks the reporting domain.
I fixed those and made one config that reads the machine’s hostname, so the same file works on every node. Then I installed Alloy on hp01, hp02, hp03, and beta from Grafana’s apt repository without version holds, letting it update with everything else.
Each node also runs Debian’s prometheus-node-exporter-collectors package and Alloy’s systemd collector to report:
- SMART health and temperature for every disk, and NVMe health on
beta - pending apt upgrades and whether a reboot is needed
- whether important services like
pve-cluster,corosync, andapcupsdare running or failed
All five nodes report healthy disks and no failed services. I wrote up the details in Monitoring Proxmox hosts with Grafana Alloy.
Monitoring the backup NAS
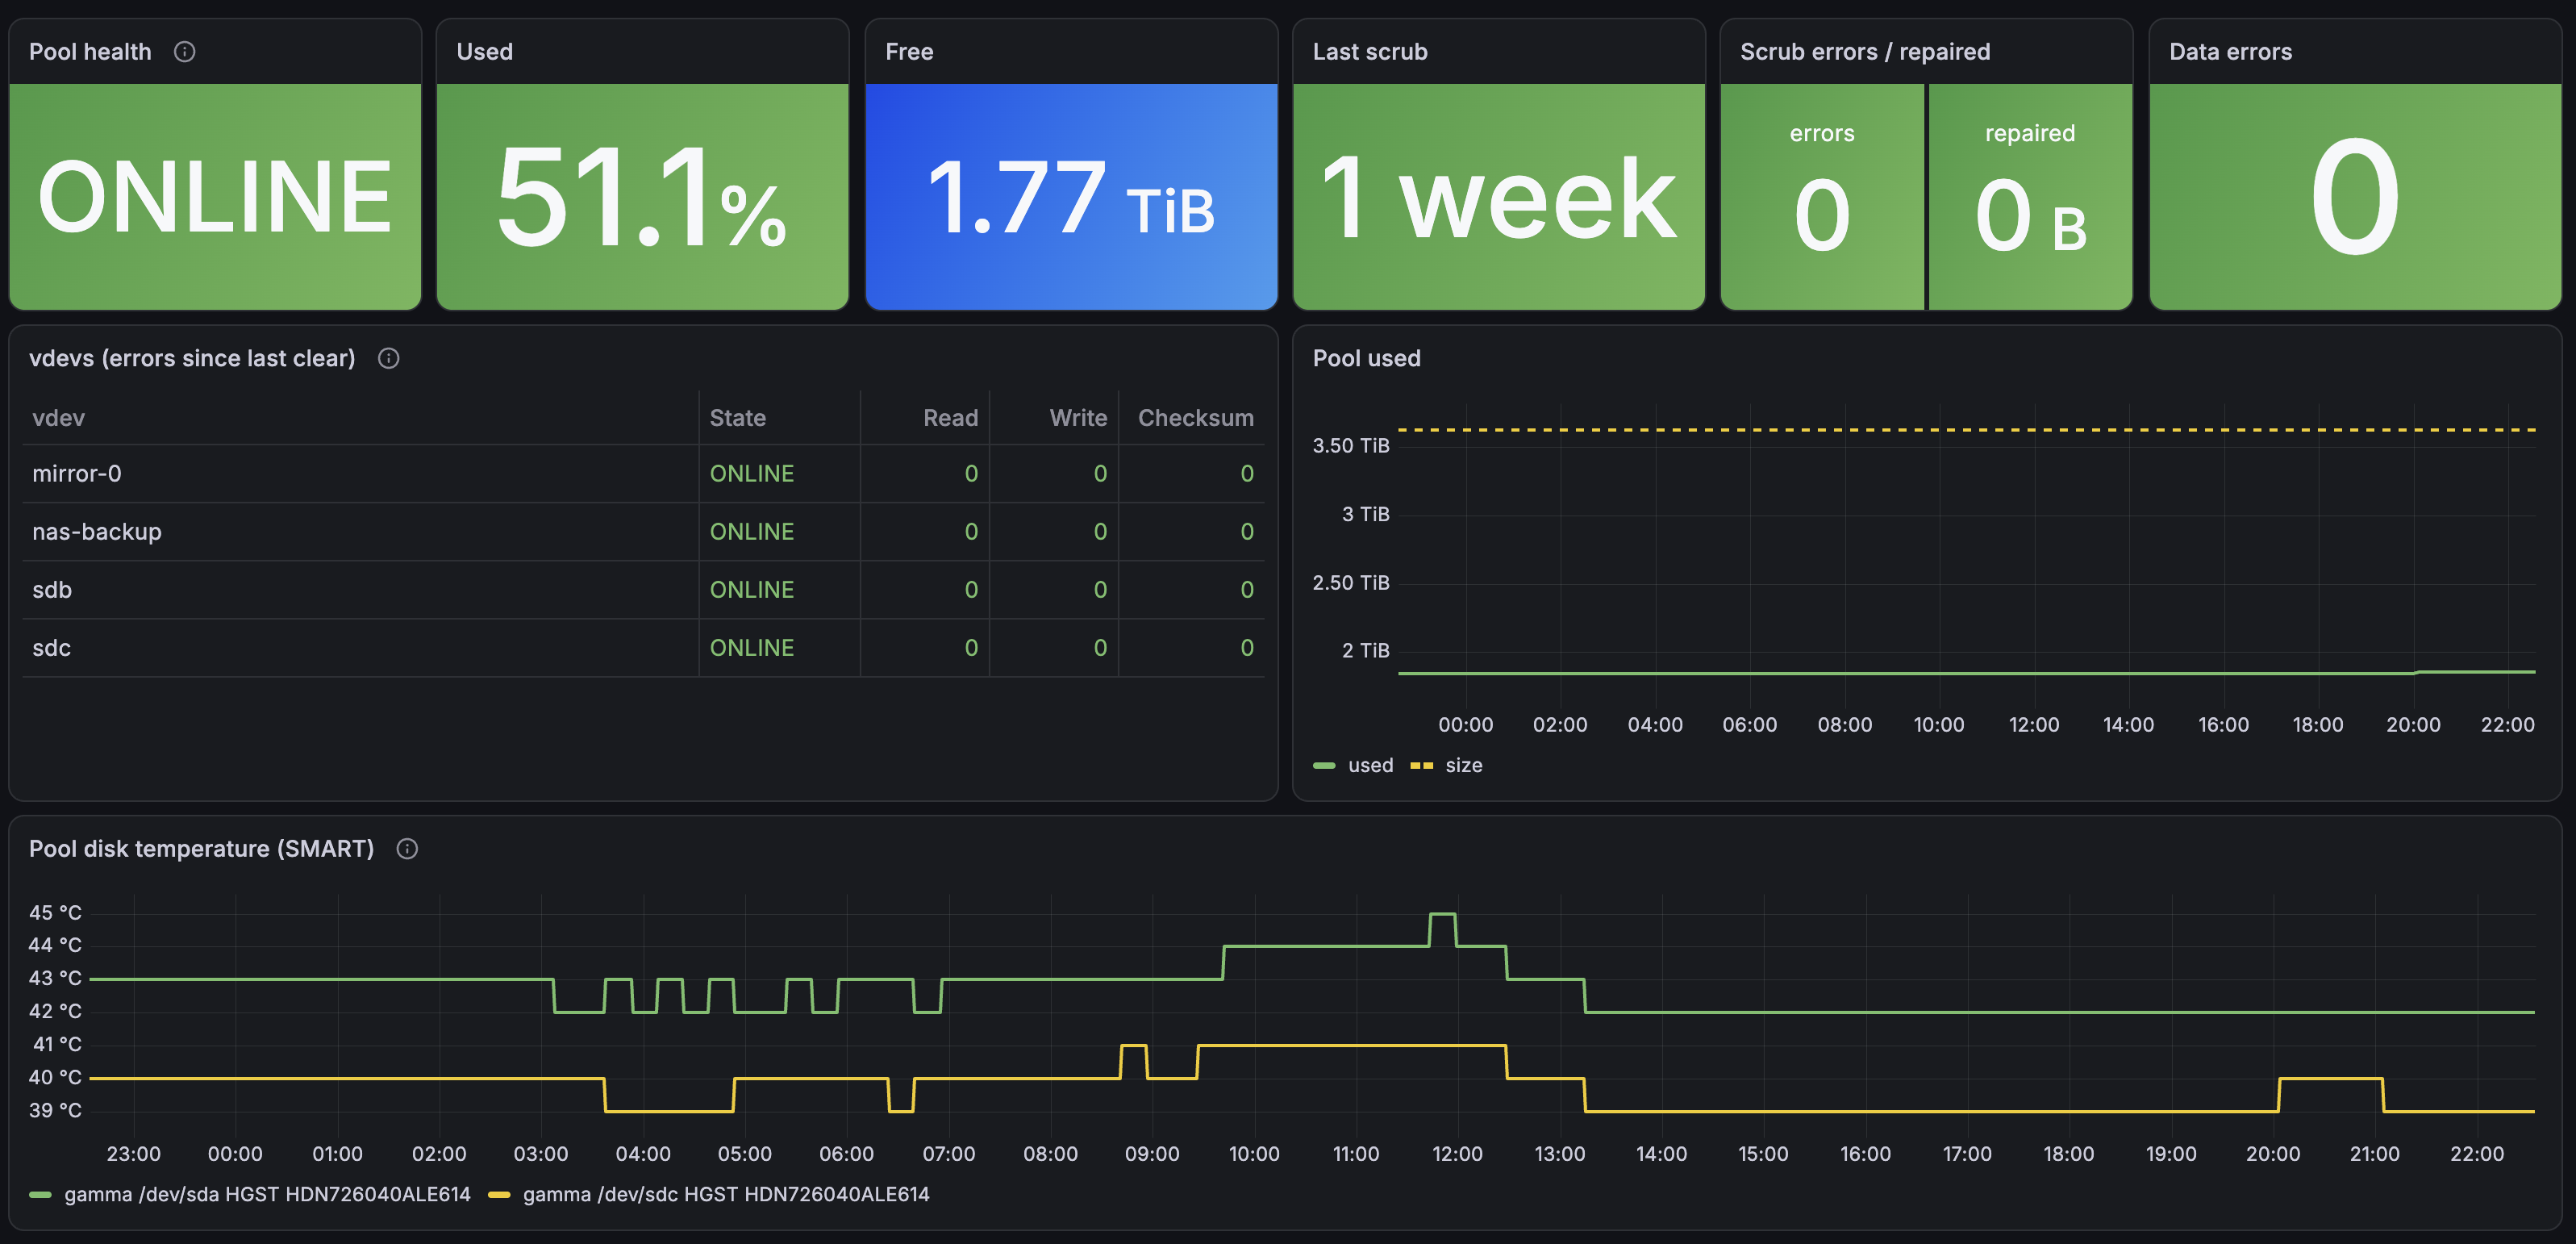
nas-backup holds my backups on a two-disk ZFS mirror (see Proxmox NAS VM). The pool wasn’t monitored before; it now reports health, capacity, last scrub time and status, plus per-disk read, write, and checksum error counts. Sunday’s monthly scrub found no errors.
I also removed three stale NFS client entries that still allowed the retired Pis’ IPs, one of which now belongs to beta. The old backups are still on the pool.
WireGuard
The WireGuard server on polaris got the same Alloy setup, plus a small script that reports when each peer last connected and how much traffic it has sent. I also wrote up how the server is built in WireGuard on an Ubuntu VM. It’s a follow-up to my 2021 post, which ran WireGuard in a Docker container.
Dashboards
I added three Grafana dashboards built on the new metrics to my grafana repo:
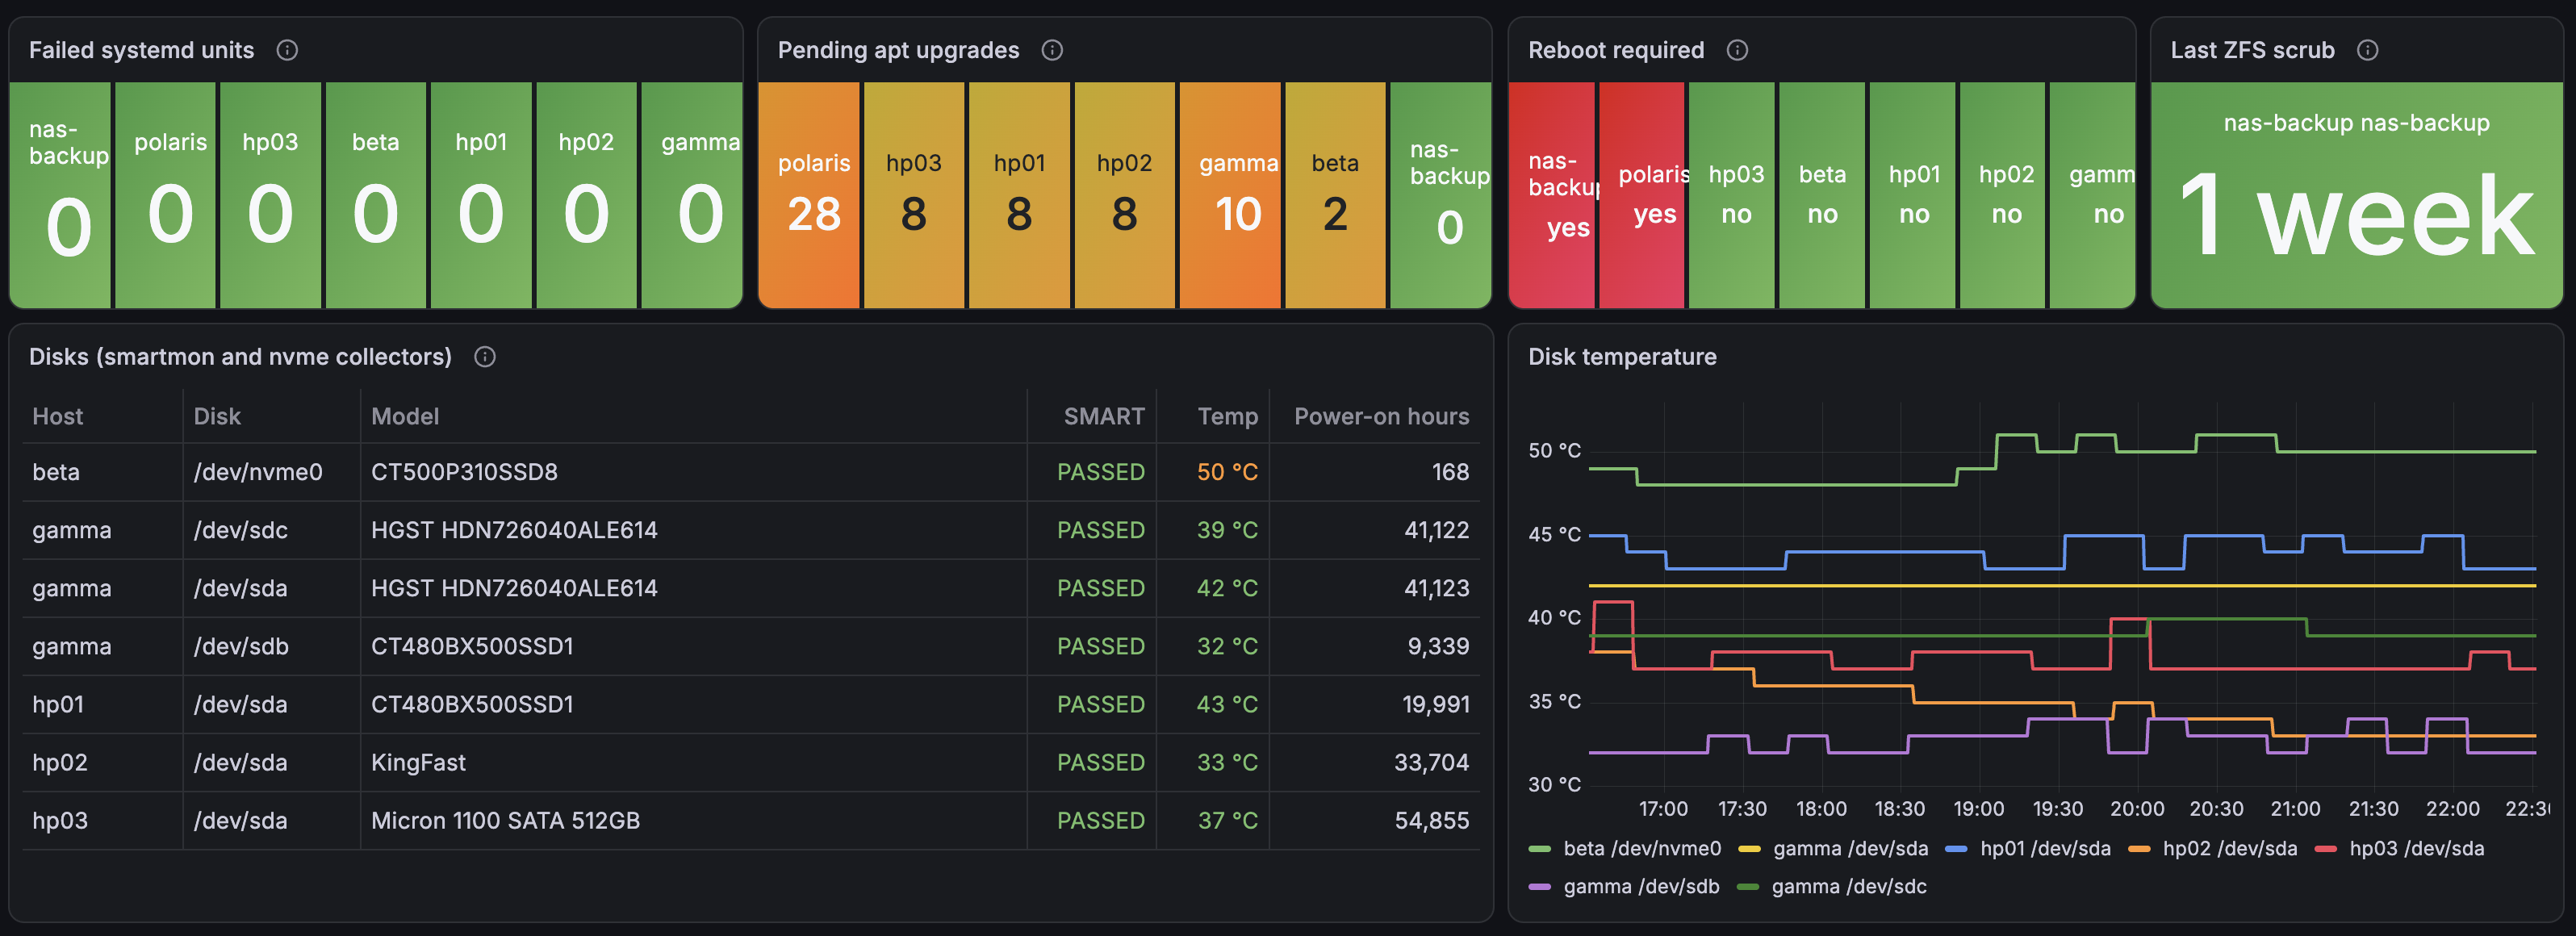
- Proxmox host health: failed systemd units, pending apt upgrades, reboot required, last ZFS scrub, and a SMART table with disk temperatures
- ZFS pool: pool health, used and free space, scrub age and results, and per-disk errors
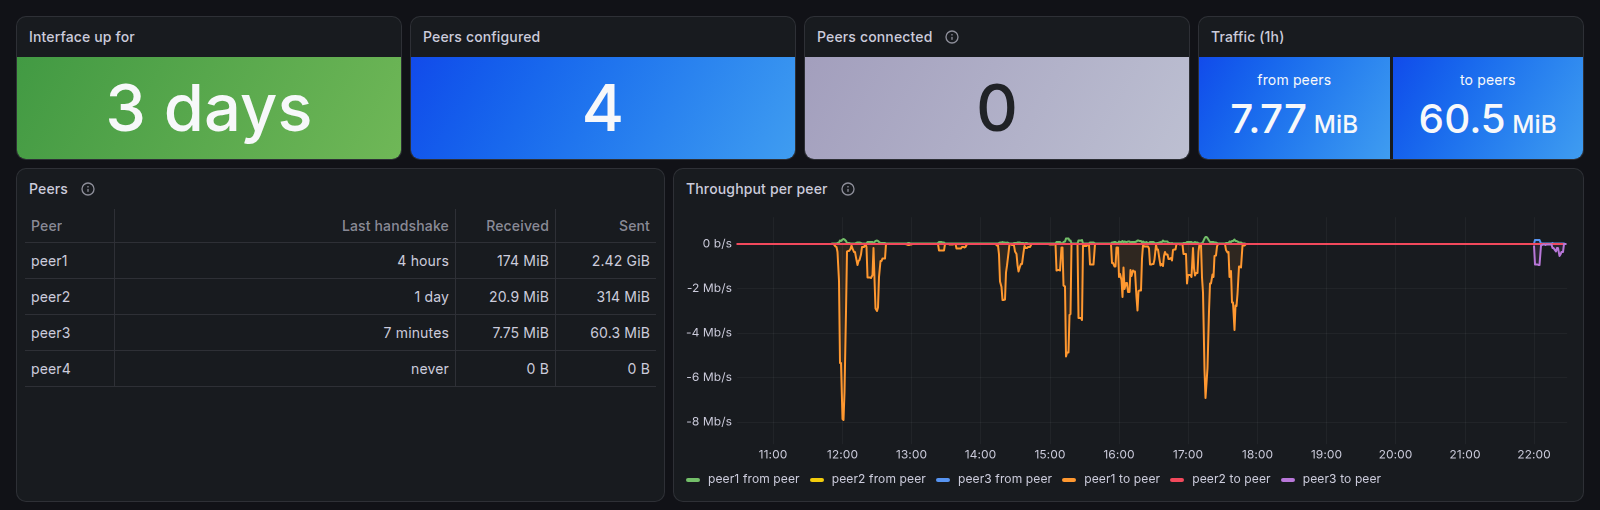
- WireGuard peers: connected peers, each peer’s last handshake, and traffic
They pick the Prometheus data source and hosts from dashboard variables instead of hard-coding them, so the same JSON works whether it’s imported in the UI, posted to the API, or provisioned from a file.
The Proxmox host health dashboard covers all five nodes plus nas-backup and polaris. Nothing has failed and every disk passes SMART, but nas-backup and polaris are both waiting on a reboot after their last round of upgrades:
The ZFS pool dashboard shows the nas-backup mirror about half full, with no errors on either disk since last week’s scrub:
The WireGuard peers dashboard shows when each peer last connected and how much traffic it has moved. This is the same 12-hour view from the WireGuard post:
Updates
Renovate opened the usual stream of pull requests. The ones I merged:
- kube-prometheus-stack went up a major chart version, from 92.21 to 93.2, and the Open WebUI chart from 17.5 to 18.3. Both synced cleanly in Argo CD.
- The CloudNativePG Barman Cloud plugin went to 0.16.0, which adds zstd compression for base backups.
- The Versity Gateway Helm chart went to 0.4.11 and then 0.4.12, and the gateway itself to 1.11.0, which adds restoring archived objects and on-demand bucket sizes in the web UI’s explorer.
- On
rigel: Grafana 13.3.1, Alloy 1.21.3, Loki 3.7.10, and the Gitea runner 5.4.1. The runner’s 6.0 update is still open because it’s a major release that removesbuiltin:checkout. - Smaller bumps to
prometheus-pve-exporter,unpoller, SearXNG, n8n, Hermes Agent, andkubediagrams.
My own projects got updates too:
- Homelab Manager, the dashboard I’m building as a front door to the house and lab, moved to Node 26, TypeScript 7, pnpm, and Oxlint (replacing ESLint) for v0.6.0. Its first run of the new tag-triggered release workflow passed every check, then failed to publish: the inline publish script mixed CommonJS
require()with top-levelawait, which Node rejects as ambiguous. Running it withnode --input-type=modulefixed it. - The Winding Gallery moved to Node 26, Three.js r187, and pnpm 12.18 in one pull request that replaced three from Renovate. CI now tests Node 22, 24, and 26 because the published CLI still supports Node 22.
- The example app in my grafana repo moved from npm to pnpm on Node 26.
- Sector Zero, my terminal dashboard, moved to Bubble Tea v2 and Lip Gloss v2 in v0.1.0-rc.4. Renovate’s pull requests for both couldn’t build because the v2 modules moved to
charm.land/bubbletea/v2andcharm.land/lipgloss/v2and their APIs changed, so I did the upgrade by hand. One change isn’t in the upgrade guide: Lip Gloss v2 counts a border inside a panel’s width and height. The golden-file tests caught the size difference. - hass-poller had five Renovate pull requests waiting, so I combined them into one: Go 1.27.4, pgx 5.13, the Prometheus Go client 1.25, and TimescaleDB 2.31. The Go update had been failing
govulncheckbecause Renovate bumped only the Dockerfile builder image, leavinggo.mod(which CI uses) on the vulnerable 1.27.3.
Herdr across the lab
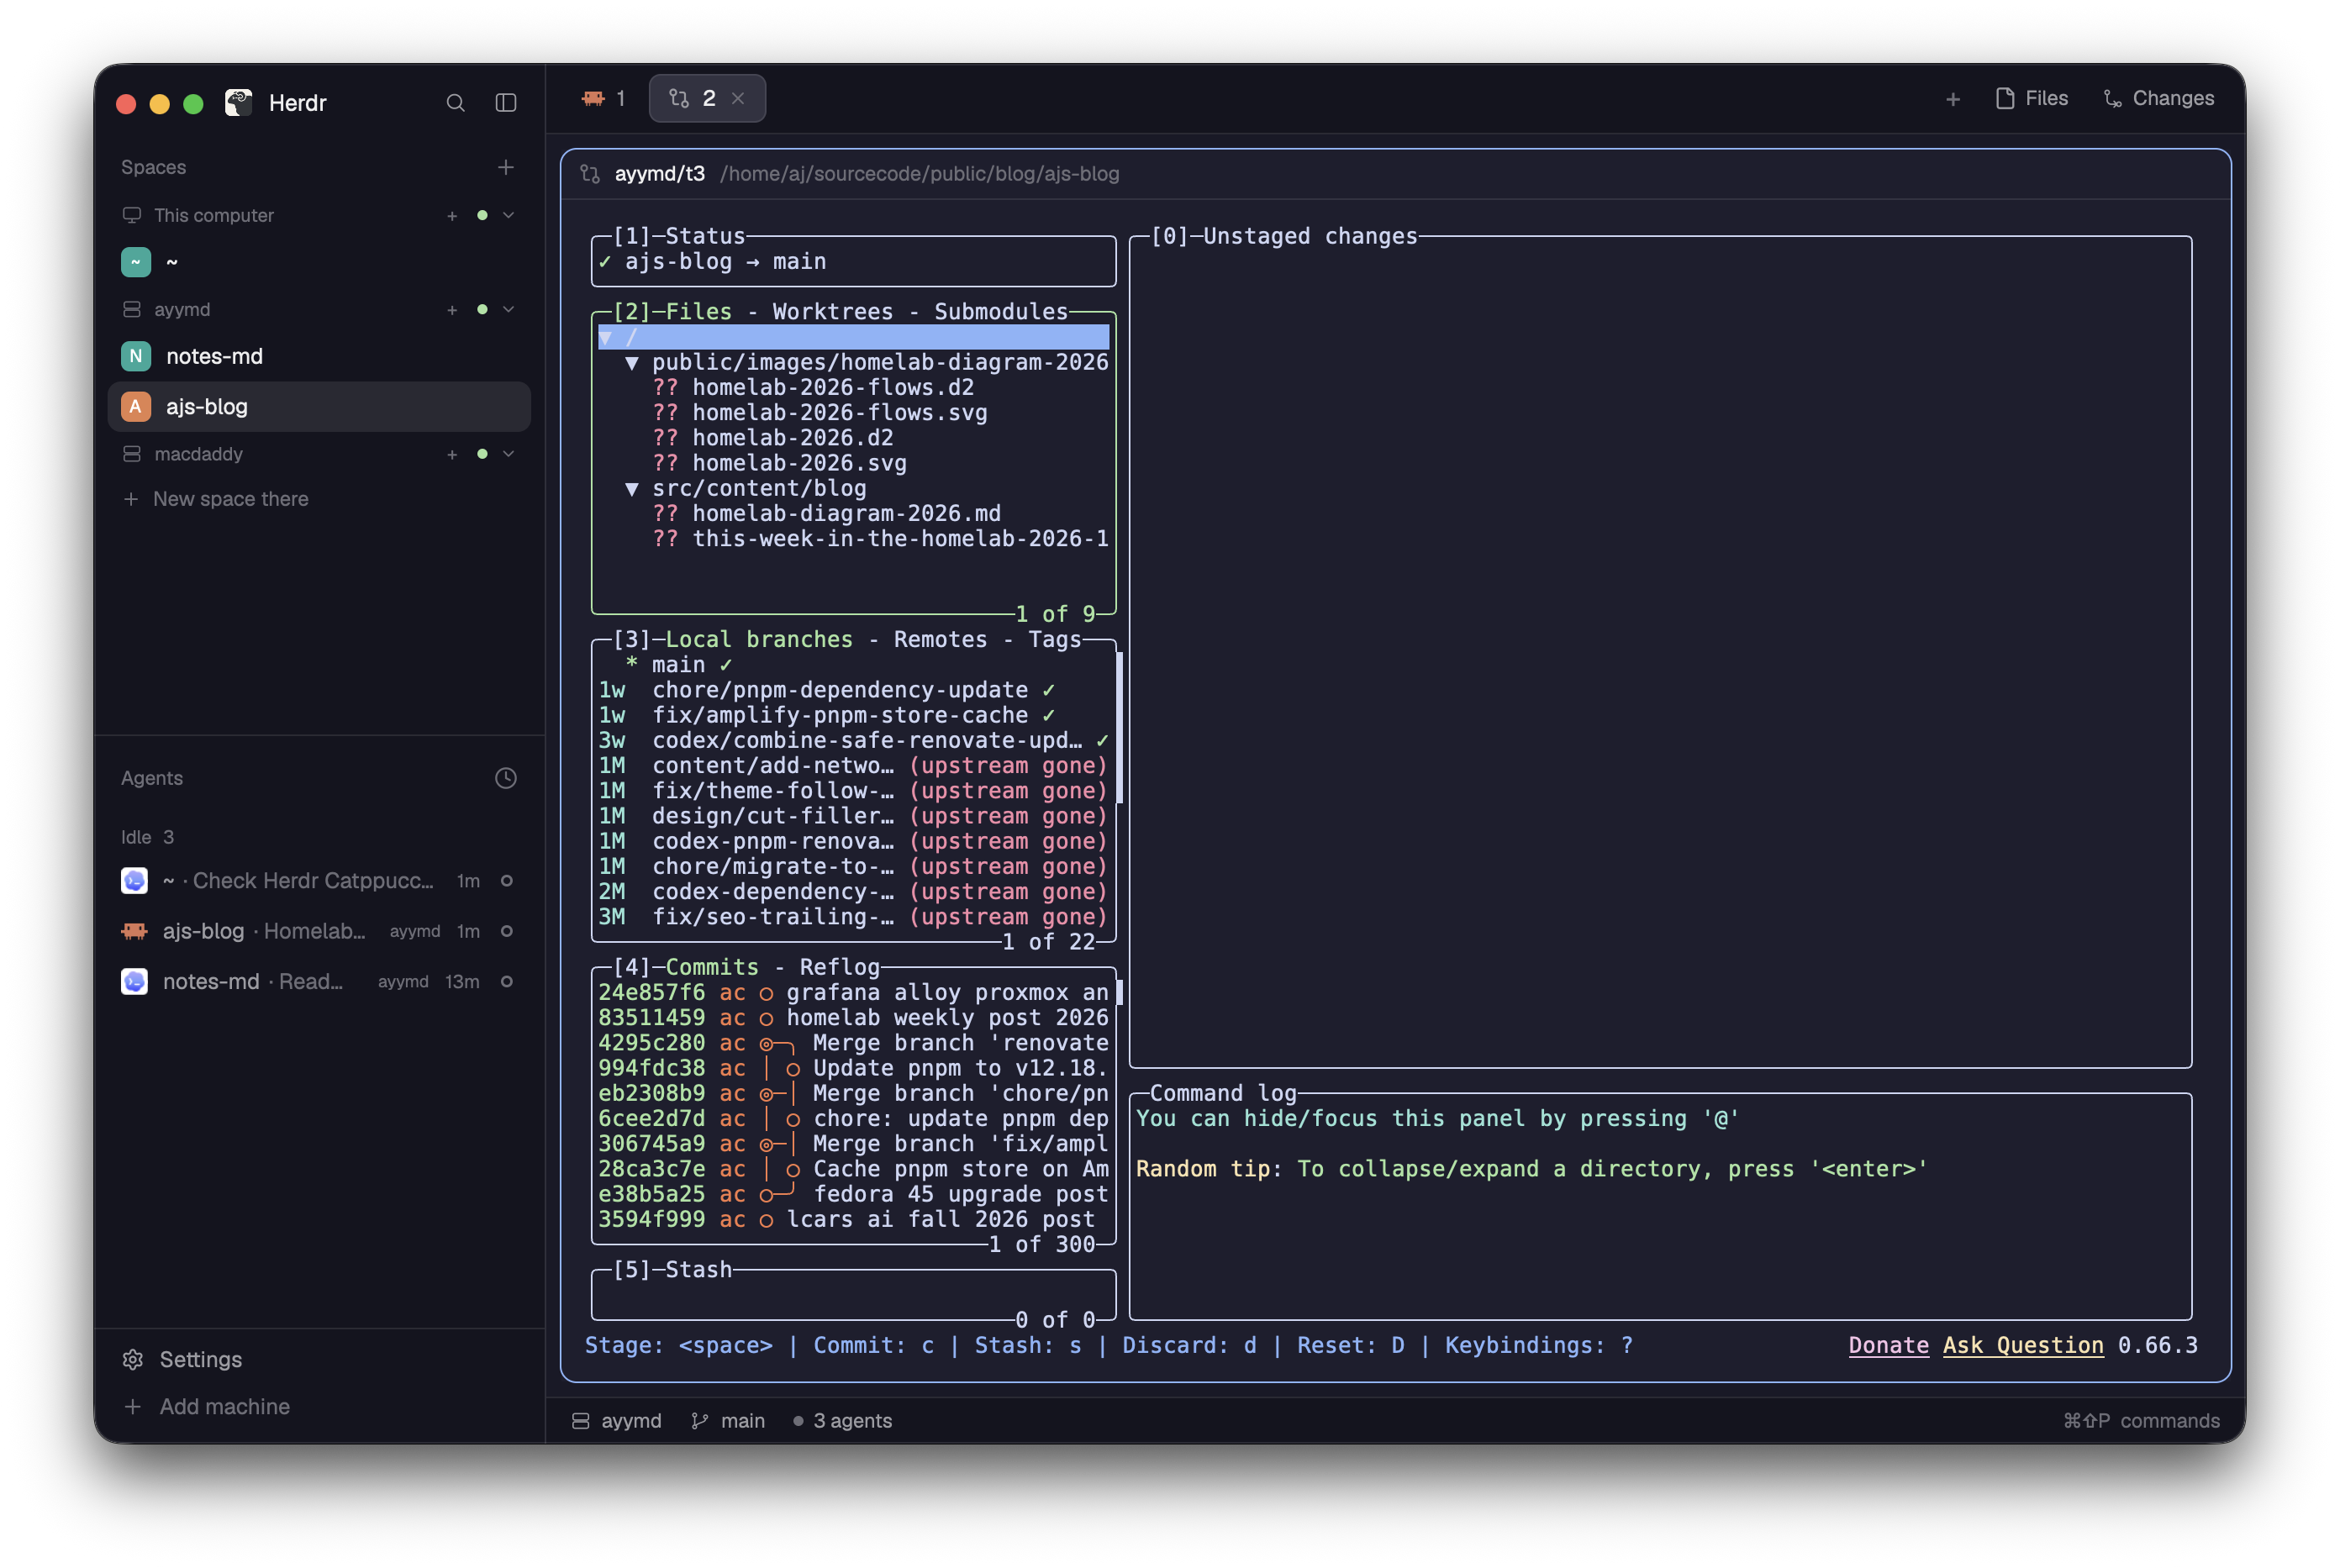
I set up Herdr across my Linux workstation (ayymd), Mac mini (macdaddy), and MacBook. Herdr Core runs on the workstation and Mac mini, installed through mise with machine-specific config.local.toml files so the shared config stays portable. The MacBook got the desktop app with brew install --cask herdr-app, then connected to the workstation over SSH. I also verified the mobile app connects, so I can check on agents and reply from my phone.
The desktop app on the MacBook lists every machine it can reach in the sidebar, along with the agents running on each one. Here it’s running lazygit in this blog’s repository on the workstation:
Herdr TUI and the desktop/mobile apps use separate servers. My existing TUI sessions can keep running alongside Core, but only Core terminals show up in the newer apps.
I also aligned the Mac mini’s main mise config with the Linux workstation and moved it to Node 26.13.1 LTS, reinstalling all seven mise-managed npm CLIs and rebuilding their shims. Because the running Core server had inherited Node 24 in its environment, I refreshed its environment so newly launched commands use Node 26 too.
Workstation tools
My linux_setup repo holds the mise manifest I install on my Linux workstation. I replaced three tools I’d been carrying for years with newer ones, all installed through mise:
- Yazi replaces ranger as the terminal file manager. A small
yZsh function wraps it so the shell changes to whatever directory I was in when I quit. - xh replaces HTTPie for HTTP requests from the command line, and Posting adds a TUI for building and saving requests.
- doggo replaces
dogfor DNS lookups.
The manifest also had drifted from what was installed: it now pins Node to the 26 LTS line, tracks mcp-grafana, which I’d installed but never added, and moves the Gitea CLI tea from a 0.15.1 pin to latest.
Smaller things
- My home directory backup script now writes archives to
~/backupsinstead of the top of my home directory, and leaves that folder out of the archive. It also skips more caches and build output: npm, pnpm, and Yarn caches, Go and Cargo module caches, Rusttargetdirectories, and Python and JavaScript tool caches. - Replaced a stale SSH host key for
polaris’s address in myknown_hosts. Before trusting the new key, I read its fingerprint from inside the VM through the Proxmox guest agent.
Next
I will be spending more time testing the herdr desktop and mobile app to see if it fits my workflow. I switched to a tool with more features at work but at home I have less time to work on projects and have more simple requirements.