Running CloudNativePG on Kubernetes with Argo CD
PostgreSQL is the database I like using, and for years the answer to “how do I run it on Kubernetes” was either “use a hosted service” or “write your own StatefulSet and hope you enjoy when it blows up.” CloudNativePG closes that gap. It is a Kubernetes operator that owns the lifecycle of a PostgreSQL cluster end to end, so I can declare a Cluster resource and let the controller handle failover, replication, backups, scaling, minor version upgrades, and connection routing. If you are not familiar with Kubernetes, check out a previous post for an introduction.
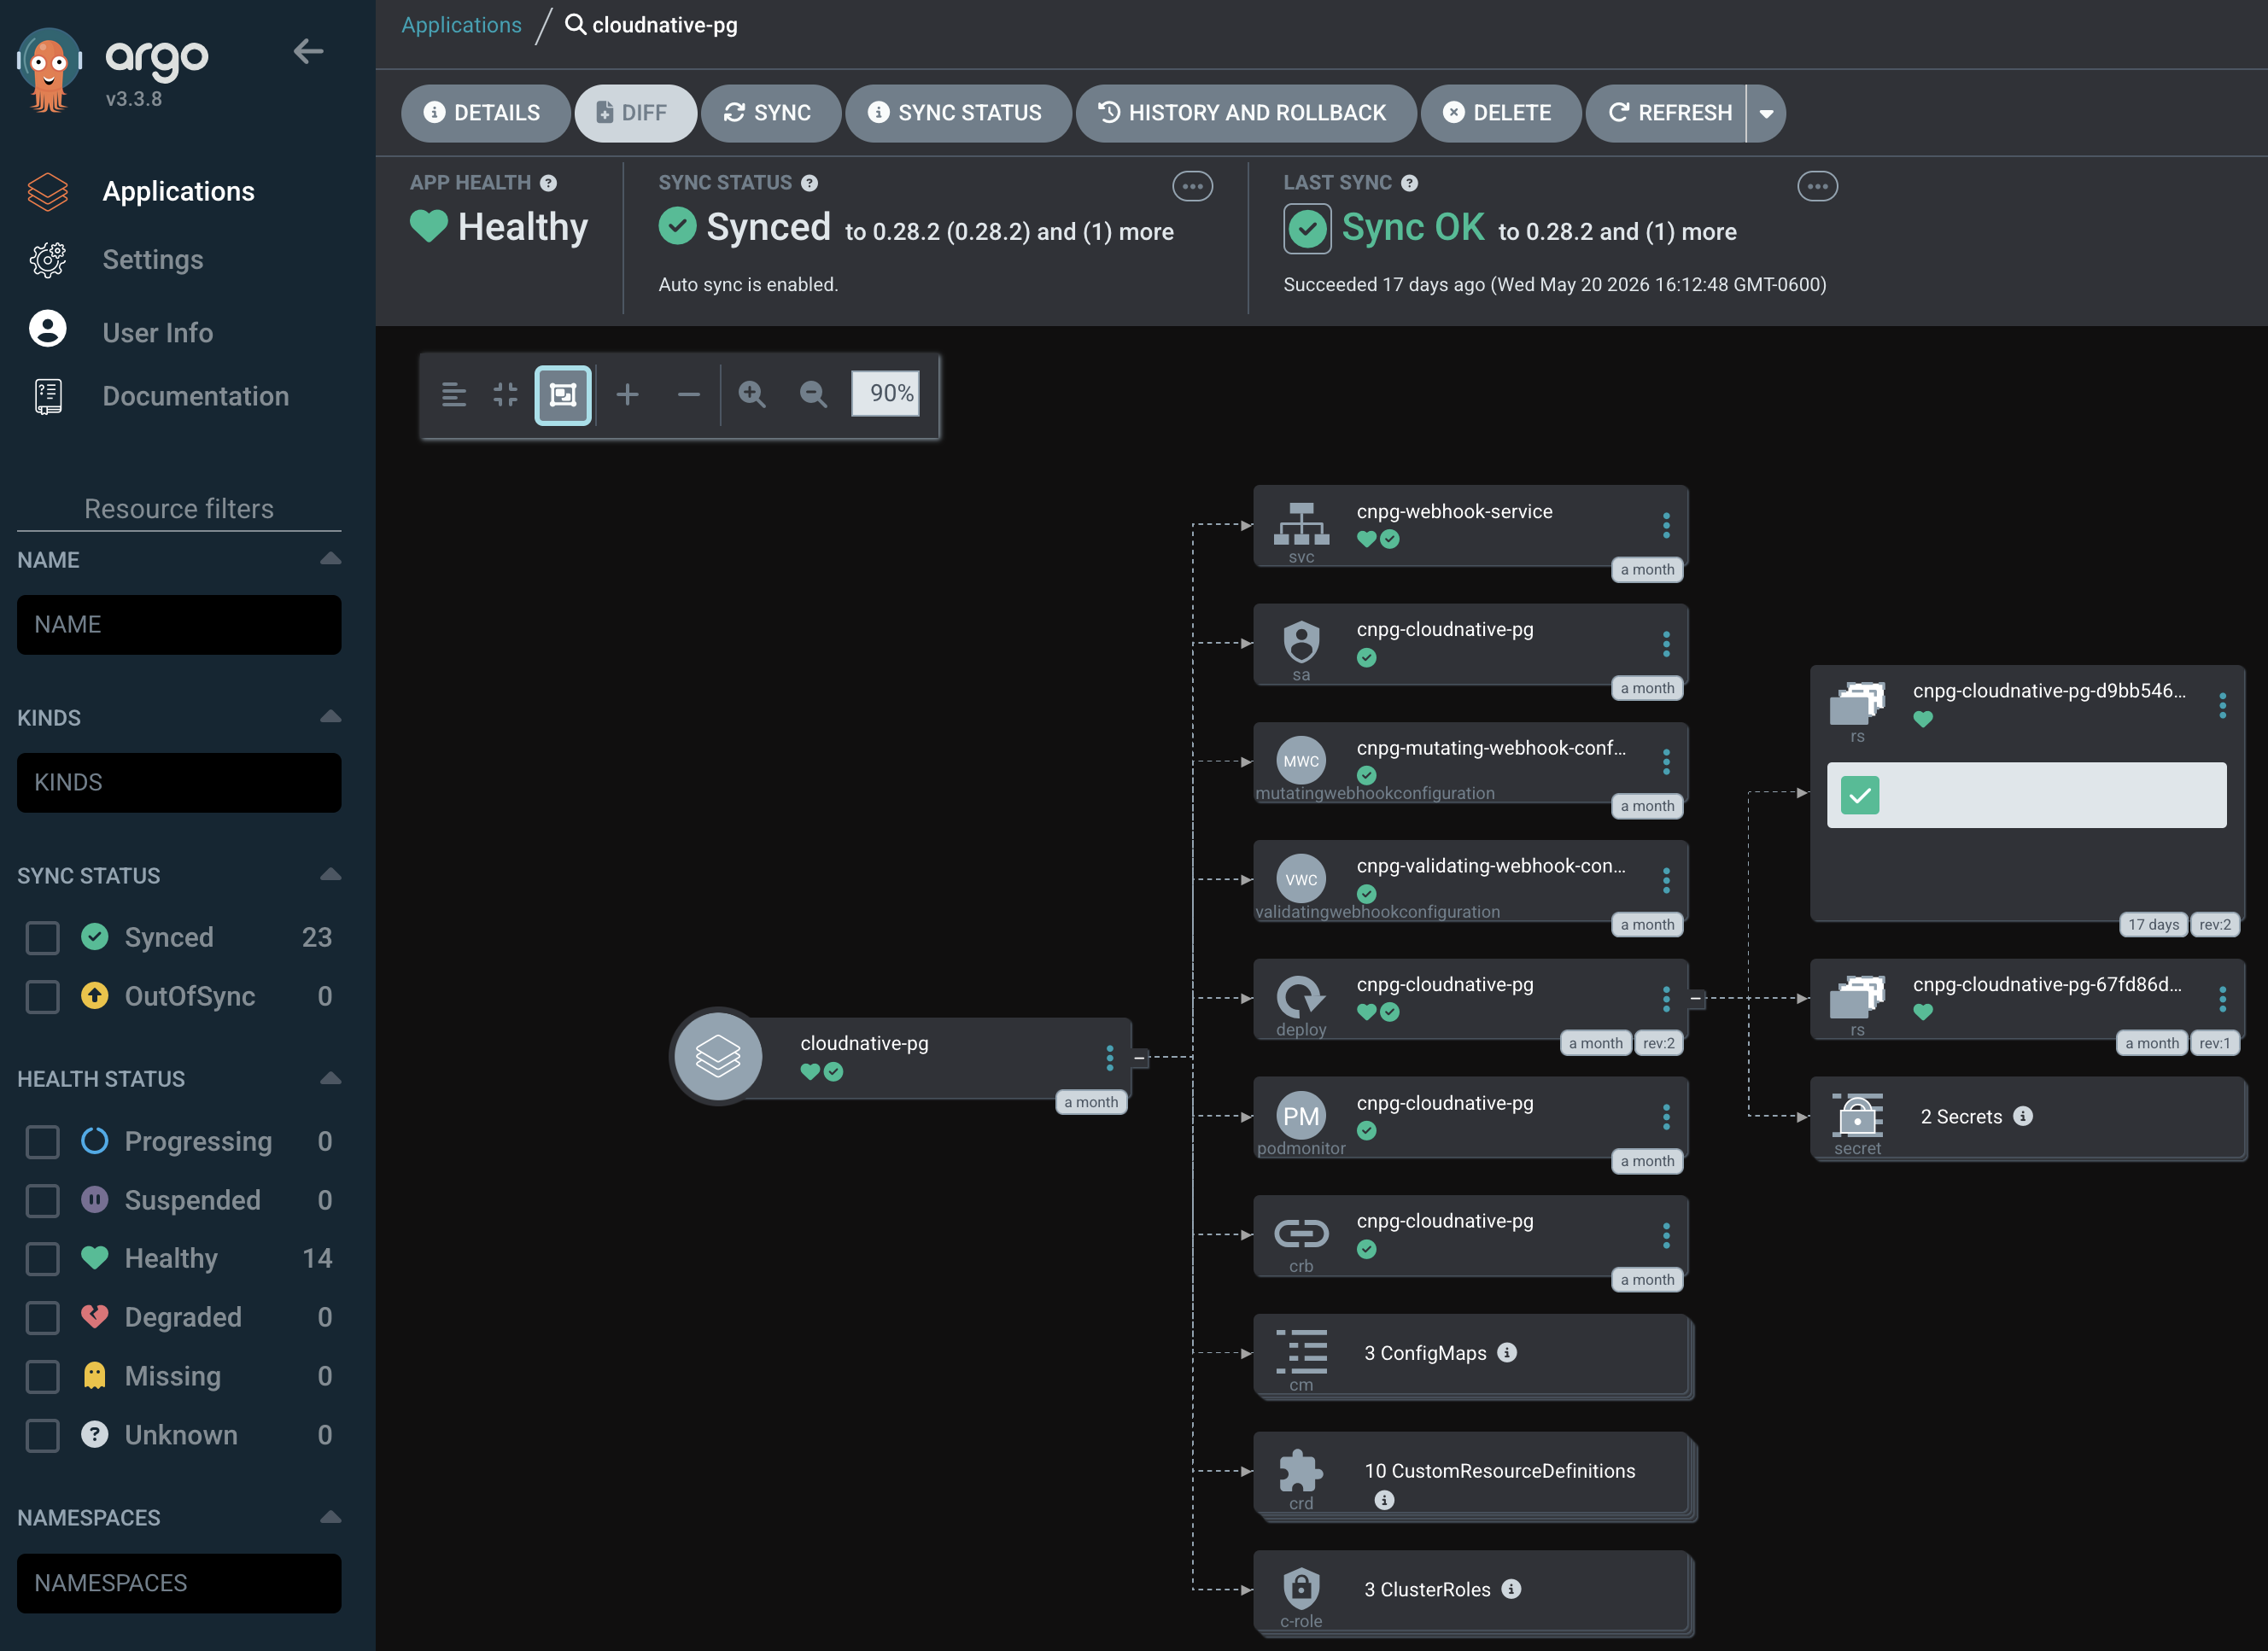
I recently added the operator to an Argo CD app-of-apps repo and brought up my first managed Database in Kubernetes. This post walks through both pieces and shows how a regular Deployment can consume the database the operator provisions.
Why a PostgreSQL operator
Plain StatefulSets are fine for some workloads, but PostgreSQL is the opposite of stateless and the day-2 work is where things get out of hand quickly. CloudNativePG handles the parts you would otherwise build by hand:
- Primary election and failover. It promotes a healthy replica when the primary goes away and updates the read-write Service to point at the new one.
- Streaming replication. Replicas are configured automatically. Adding an instance is a single field change.
- Stable connection endpoints. Three Services per cluster:
<name>-rwfor the current primary,<name>-rofor replicas only, and<name>-rfor any instance. Apps point at the role they need; the operator keeps the selectors current. - Initial database and roles. A bootstrap section creates the database and application user on first start, including a generated password stored in a Secret.
- Backups and PITR. Continuous WAL archiving and base backups can land in object storage when configured.
- Minor version upgrades. The operator can roll instances through controlled restarts in replication order.
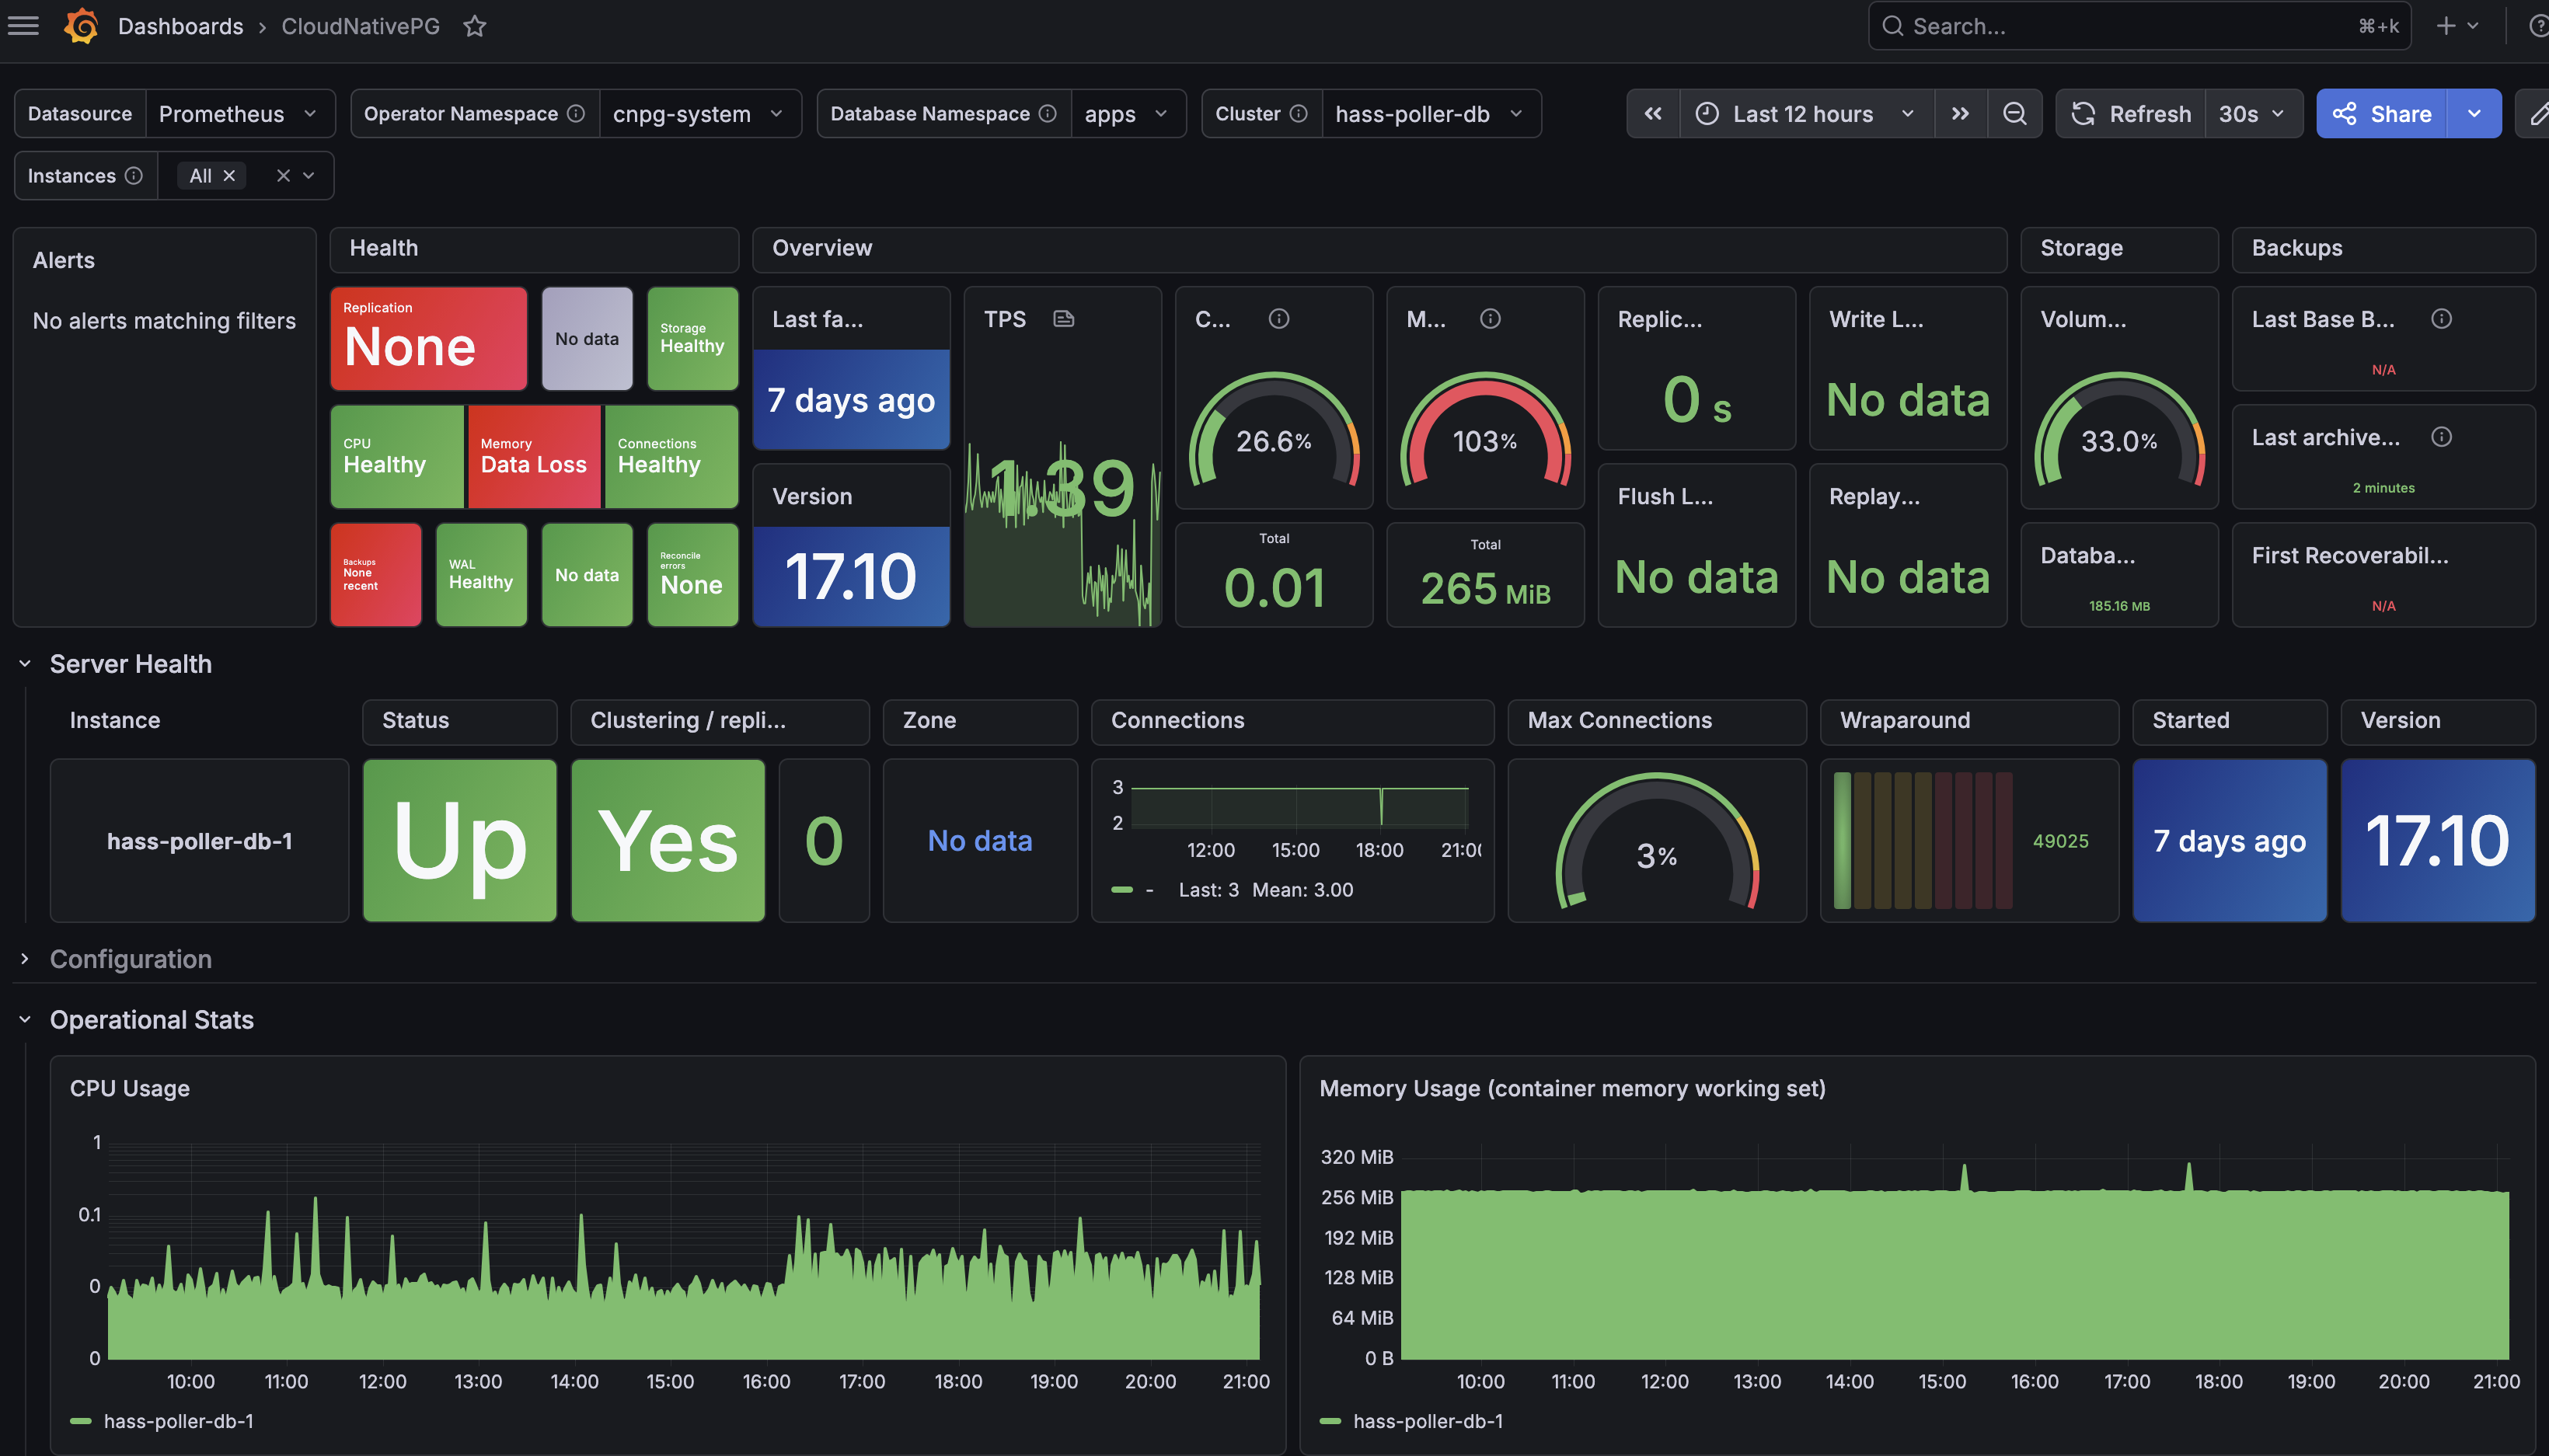
- Monitoring. Each instance exposes a Prometheus metrics endpoint.
Compared to a hosted database, the tradeoff is the usual homelab one: I own backups, capacity, and upgrades, but I keep the data on my hardware and avoid per-gigabyte database pricing.
Argo CD layout
I deploy the operator and each database cluster as separate Argo CD apps. The operator is shared infrastructure; each cluster has its own lifecycle, credentials, and retention policy.
argo-apps/apps/cloudnative-pg/
  app.yaml          # Multi-source: chart + values from Git
  values.yaml       # Operator chart values

argo-apps/apps/app-db/
  app.yaml          # Path-only source pointing at templates/
  templates/
    cluster.yaml
    podmonitor.yaml
The root Argo CD app already includes argo-apps/apps/*/app.yaml, so dropping in a new directory is enough to register another app.
The operator app
The operator ships as the cloudnative-pg Helm chart. The Argo CD Application uses the multi-source pattern so chart values can live as a separate file in the same Git repo:
apiVersion: argoproj.io/v1alpha1
kind: Application
metadata:
  name: cloudnative-pg
  namespace: argocd
spec:
  destination:
    namespace: cnpg-system
    server: https://kubernetes.default.svc
  project: default
  sources:
    - chart: cloudnative-pg
      repoURL: https://cloudnative-pg.github.io/charts
      targetRevision: 0.28.0
      helm:
        releaseName: cnpg
        valueFiles:
          - $values/argo-apps/apps/cloudnative-pg/values.yaml
    - repoURL: https://git.example.com/example/platform-manifests.git
      targetRevision: main
      ref: values
  syncPolicy:
    automated:
      prune: true
      selfHeal: true
    syncOptions:
      - CreateNamespace=true
      - ServerSideApply=true
The values file enables the CRDs, asks the chart to ship a PodMonitor for the operator, and writes a Grafana dashboard ConfigMap into the monitoring namespace where the existing kube-prometheus-stack Grafana sidecar can discover it:
crds:
  create: true

monitoring:
  podMonitorEnabled: true
  podMonitorAdditionalLabels:
    release: prometheus
  grafanaDashboard:
    create: true
    namespace: monitoring

resources:
  requests:
    cpu: 50m
    memory: 128Mi
After Argo CD syncs, the operator pod, CRDs, and webhooks are in place. From here, every database is just a Cluster custom resource.
Creating a cluster
This example cluster is a single-instance PostgreSQL database for general-purpose homelab use:
apiVersion: postgresql.cnpg.io/v1
kind: Cluster
metadata:
  name: app-db
  namespace: apps
spec:
  instances: 1

  bootstrap:
    initdb:
      database: app
      owner: app

  storage:
    size: 5Gi

  resources:
    requests:
      cpu: 100m
      memory: 256Mi
A few things worth calling out:
instances: 1is a homelab choice. Bump it to at least 3 for a primary plus replicas.bootstrap.initdbcreates theappdatabase andapprole on first start. CloudNativePG generates a random password and stores it inSecret/app-db-app.storage.size: 5Giwith nostorageClassuses the cluster default. To pin one explicitly, addstorageClass: <storage-class-name>.- I do not set
imageName, so the operator chooses the default PostgreSQL image for its version.
Once Argo CD syncs the cluster, the operator creates the StatefulSet, PVC, and three Services:
NAME       TYPE        PORT(S)
app-db-rw  ClusterIP   5432/TCP   # primary, read-write
app-db-ro  ClusterIP   5432/TCP   # replicas only
app-db-r   ClusterIP   5432/TCP   # any instance
Connecting an application
The operator publishes application credentials in Secret/<cluster>-app. CloudNativePG documents that the generated application Secret includes the username, password, host, port, database name, pgpass, and ready-made URI values.
For a generic app, I like using envFrom against that Secret and then composing a connection string that points at the read-write Service:
apiVersion: apps/v1
kind: Deployment
metadata:
  name: example-app
  namespace: apps
spec:
  replicas: 1
  selector:
    matchLabels:
      app: example-app
  template:
    metadata:
      labels:
        app: example-app
    spec:
      containers:
        - name: app
          image: ghcr.io/example/example-app:latest
          envFrom:
            - secretRef:
                name: app-db-app
          env:
            - name: DATABASE_URL
              value: postgres://$(username):$(password)@app-db-rw:5432/$(dbname)
envFrom.secretRef exposes every key in the Secret as an environment variable. The DATABASE_URL line then points at app-db-rw, which the operator keeps pointed at the current primary. If the app only reads, swap that to app-db-ro to spread load across replicas.
For apps that prefer a prebuilt URI, the Secret already contains one in the uri key:
env:
  - name: DATABASE_URL
    valueFrom:
      secretKeyRef:
        name: app-db-app
        key: uri
A quick sanity check from a one-shot pod is useful when bootstrapping a new app:
kubectl -n apps run psql --rm -it --restart=Never \
  --image=ghcr.io/cloudnative-pg/postgresql:17 \
  --env="PGPASSWORD=$(kubectl -n apps get secret app-db-app \
    -o jsonpath='{.data.password}' | base64 -d)" \
  -- psql -h app-db-rw -U app app -c 'select version();'
A monitoring gotcha
The Cluster spec used to support spec.monitoring.enablePodMonitor: true, but that field is deprecated in current CloudNativePG releases and will be removed. The recommended path is to omit it or set it to false and ship the PodMonitor yourself. That gives you full control over labels, which matters more than it looks.
My kube-prometheus-stack instance has podMonitorSelector: { matchLabels: { release: prometheus } }. Any monitor without that label is ignored. Two fixes solved both ends of this:
- Add the label to the operator chart values with
monitoring.podMonitorAdditionalLabels. - Ship a hand-written
PodMonitorfor the database cluster:
apiVersion: monitoring.coreos.com/v1
kind: PodMonitor
metadata:
  name: app-db
  namespace: apps
  labels:
    release: prometheus
spec:
  selector:
    matchLabels:
      cnpg.io/cluster: app-db
  podMetricsEndpoints:
    - port: metrics
The metrics port on every CloudNativePG instance pod is named metrics and listens on port 9187. Pods carry the cnpg.io/cluster: <name> label, so the selector is straightforward. Once scraping works, the Grafana dashboard from the CNPG operator chart has data to show.
Closing Thoughts
Before production
This setup is enough for a homelab service, but I would not stop here for production. Before running something important, configure at least three instances, set an explicit storage class, define backup and WAL archiving to object storage, test a restore, add resource limits that match your workload, and decide whether applications should connect through CloudNativePG’s PgBouncer Pooler.
The backup and restore test is the most important part. A PostgreSQL operator can automate a lot, but it cannot make an untested backup strategy real.
Validation
After you create a new cluster object, ensure the pods are healthy:
kubectl get cluster -n apps app-db
kubectl get pods -n apps -l cnpg.io/cluster=app-db
kubectl get svc -n apps -l cnpg.io/cluster=app-db
kubectl -n apps get secret app-db-app
A healthy cluster reports Cluster in healthy state with the primary instance name in the PRIMARY column. If the PodMonitor is wired correctly, the cnpg-controller-manager and app-db targets show up in the Prometheus UI.
Sources
- PostgreSQL
- CloudNativePG
- Argo CD
- CloudNativePG Helm chart
- Argo CD multi-source applications
- CloudNativePG bootstrap documentation
- CloudNativePG application connection documentation
- CloudNativePG monitoring documentation
- CloudNativePG backup documentation
- CloudNativePG connection pooling documentation