Homelab logging with grafana loki
updated 2025-04-17: This version of Loki and Promtail is now deprecated.
See a newer post about how to upgrade/install v3 of Grafana Loki as of 2025.
![]()
Once there is more than one computer to worry about, having logs in one location to search for errors and troubleshoot applications becomes critical. In a previous post I set up prometheus to collect metrics and grafana to visualize the metrics. Today I am going to look at another tool from grafana called loki. Loki will provide a server to collect logs and we will install an agent on systems to send their logs to the loki server.
Install loki on proxmox lxc
My monitoring software is on a raspberry pi system. This system uses a micro sd card as the file system storage. I am going to install loki on a more powerful system that has a ssd to support log storage.
I’m going to use an existing proxmox server and use a LXC container to host the loki server. If you are not familiar with lxc containers and proxmox, check out a previous post for an introduction.
I am going to use an openSUSE container template because there is a package repository for installing loki on openSUSE.
Download lxc template
Before creating the new container, download the image into proxmox storage. If you’re unsure to which one, you can use the local storage. For clustered installations, it is preferred to use a shared storage so that all nodes can access those images. I will use NFS storage.
pveam update

pveam available |grep -i suse
Output:
system opensuse-15.3-default_20210925_amd64.tar.xzpveam download images opensuse-15.3-default_20210925_amd64.tar.xzOutput:
...
...
calculating checksum...OK, checksum verified
download of 'http://download.proxmox.com/images/system/opensuse-15.3-default_20210925_amd64.tar.xz' to '/mnt/pve/images/template/cache/opensuse-15.3-default_20210925_amd64.tar.xz' finished
Note images is the name of my NFS storage, replace this with a proxmox store appropriate for your setup.
Now the image is available to deploy.
Deploy lxc container with terraform
Let’s deploy the lxc container for loki using terraform. If you are not familiar with terraform on proxmox, check out a previous post to get started.
Create a new tf file or add on to an existing one.
resource "proxmox_lxc" "loki_lxc" {
  target_node  = "hp"
  hostname     = "loki"
  cores        = 2
  memory       = 4096
  onboot       = true
  ostemplate   = "images:vztmpl/opensuse-15.3-default_20210925_amd64.tar.xz"
  unprivileged = true

  rootfs {
    storage = "local-lvm"
    size    = "100G"
  }

  network {
    name   = "eth0"
    bridge = "vmbr0"
    ip     = "dhcp"
  }
}
Note in the network block, I have entered “dhcp” for testing but if you want to utilize loki permanently, enter a static IP address such as: "192.168.1.111/24".
You can use the IP later on when configuring systems to send logs to the loki IP address or DNS hostname.
Create the container with terraform:
terraform apply

...
...
...
Plan: 1 to add, 0 to change, 0 to destroy.

Do you want to perform these actions?
  Terraform will perform the actions described above.
  Only 'yes' will be accepted to approve.

  Enter a value: yes

proxmox_lxc.loki_lxc: Creating...
proxmox_lxc.loki_lxc: Still creating... [10s elapsed]
proxmox_lxc.loki_lxc: Creation complete after 14s [id=pve/lxc/100]

Apply complete! Resources: 1 added, 0 changed, 0 destroyed.
Now, from the proxmox host, attach to the container and replace <vmid> with the id assigned to your lxc container:
lxc-attach <vmid>Once connected to the container, add the repo for logging:
zypper ar https://download.opensuse.org/repositories/security:/logging/openSUSE_Leap_15.3/security:logging.repo

zypper ref

...
Do you want to reject the key, trust temporarily, or trust always? [r/t/a/?] (r): a
Trust the gpg key for the repo by entering “a” and then install loki:
zypper in loki promtail -yOnce installed, we can start and enable the loki and promtail service:
systemctl enable --now loki
systemctl enable --now promtail
Now loki should be accessible on port 3100
ansible playbook
Here is an ansible playbook to perform the previous steps. Check out a previous post if you are not familiar with ansible. The lxc container needs to have an ssh server and a non-root user with sudo access.
zypper in openssh-server

systemctl enable --now sshd
Simple playbook for opensuse leap 15.3
---
- hosts: all
  become: yes
  tasks:
    - name: "Add logging repo to {{ ansible_hostname }}"
      community.general.zypper_repository:
        repo: 'https://download.opensuse.org/repositories/security:/logging/openSUSE_Leap_15.3/security:logging.repo'
        auto_import_keys: yes
    - name: "Add loki packages"
      community.general.zypper:
        name:
          - loki
          - promtail
        state: present
        update_cache: yes
    - name: "Start loki services"
      systemd:
        name: loki
        state: started
        enabled: yes
    - name: "Start promtail service"
      systemd:
        name: promtail
        state: started
        enabled: yes
Run this with the command
ansible-playbook playbook.yml -i 'loki.server,'Configure promtail targets
Any system that you want to collect logs will need the promtail agent. I prefer this to using rsyslog because promtail can send logs over HTTPS which means logs will be encrypted in transit unlike with rsyslog which is not encrypted. To make loki more secure, use a reverse proxy for the plain text loki port 3100 to accept traffic from HTTPS port 443. Check out a previous post for how to set up a proxy server that can be configured through a portal.
There should be one promtail agent already on the lxc system where loki was installed. Before proceeding, verify that loki is operational. Log into another system that you would like to forward logs and see if loki is ready:
curl http://loki.server:3100/ready
ready
Now we will prepare a configuration file for the promtail agent on the remote server.
mkdir -p /etc/loki

vim /etc/loki/promtail-config.yaml
Replace the localhost url with your loki server.
server:
  http_listen_port: 9080
  grpc_listen_port: 0

positions:
  filename: /tmp/positions.yaml

clients:
  - url: http://localhost:3100/loki/api/v1/push

scrape_configs:
- job_name: system
  static_configs:
  - targets:
      - localhost
    labels:
      job: varlogs
      __path__: /var/log/*log
This will collect all .log files in /var/log.
Collect docker logs
Now if you want to collect logs from docker containers, I found how to reconfigure the promtail agent and docker daemon to format the container logs. Loki includes a docker plugin to send logs but I run docker on raspberry pi systems which have arm64 cpu architecture. The loki docker plugin does not have an arm64 image but the promtail agent does.
We will prepare the promtail config and then configure the docker daemon to alter the format of the container logs to make it easier for us to look at in grafana. Replace the loki url with your system.
server:
  http_listen_port: 9080
  grpc_listen_port: 0

positions:
  filename: /tmp/positions.yaml

clients:
  - url: http://loki.server:3100/loki/api/v1/push

scrape_configs:
- job_name: containers
  static_configs:
  - targets:
      - localhost
    labels:
      job: containerlogs
      __path__: /var/lib/docker/containers/*/*log

  pipeline_stages:
  - json:
      expressions:
        output: log
        stream: stream
        attrs:
  - json:
      expressions:
        tag:
      source: attrs
  - regex:
      expression: (?P<image_name>(?:[^|]*[^|])).(?P<container_name>(?:[^|]*[^|])).(?P<image_id>(?:[^|]*[^|])).(?P<container_id>(?:[^|]*[^|]))
      source: tag
  - timestamp:
      format: RFC3339Nano
      source: time
  - labels:
      tag:
      stream:
      image_name:
      container_name:
      image_id:
      container_id:
  - output:
      source: output
The promtail agent is available as a docker image. We can deploy this image with docker-compose. If you are not familiar with docker, check out a previous post to see how to run these containers. The section logging will demonstrate how we can configure new and existing containers to format their logs for loki.
docker-compose.yml
version: "3.0"
services:
  promtail:
    container_name: promtail
    image: grafana/promtail:2.3.0
    restart: unless-stopped
    volumes:
      - /var/lib/docker/containers:/var/lib/docker/containers:ro
      - /etc/loki/promtail-config.yaml:/etc/promtail/promtail-config.yaml
    command: -config.file=/etc/promtail/promtail-config.yaml
    logging:
      driver: "json-file"
      options:
        tag: "{{.ImageName}}|{{.Name}}|{{.ImageFullID}}|{{.FullID}}"
Start this container with the command:
docker compose up -dVisualize logs in grafana
Now that we have some logs going to loki, we can use grafana to view logs and perform queries to parse through the logs. If you are not familiar with grafana, check out a previous post about visualizing metrics.
Navigate to grafana configuration page for data sources: grafana.url/datasources
Select “Add data source” and then select “Loki”
The only section that needs to be filled out is HTTP > URL
In the URL text box, enter the full URL to your loki instance ex: http://loki.url:3100
Once the URL is filled out, select “Save & Test” at the bottom. Barring any error messages, Loki should now be viewable with grafana.
Select “Explore” in the navigation menu and then Select “Loki” to browse logs.
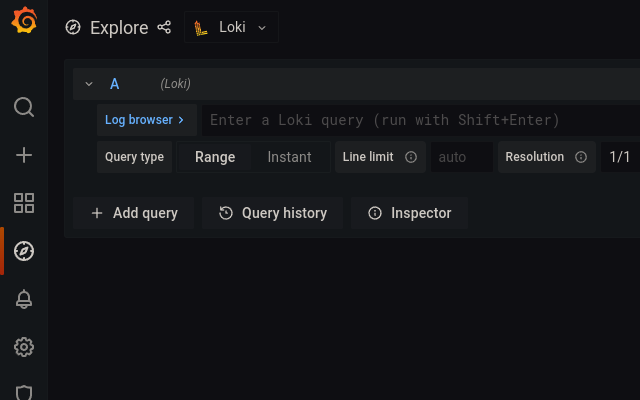
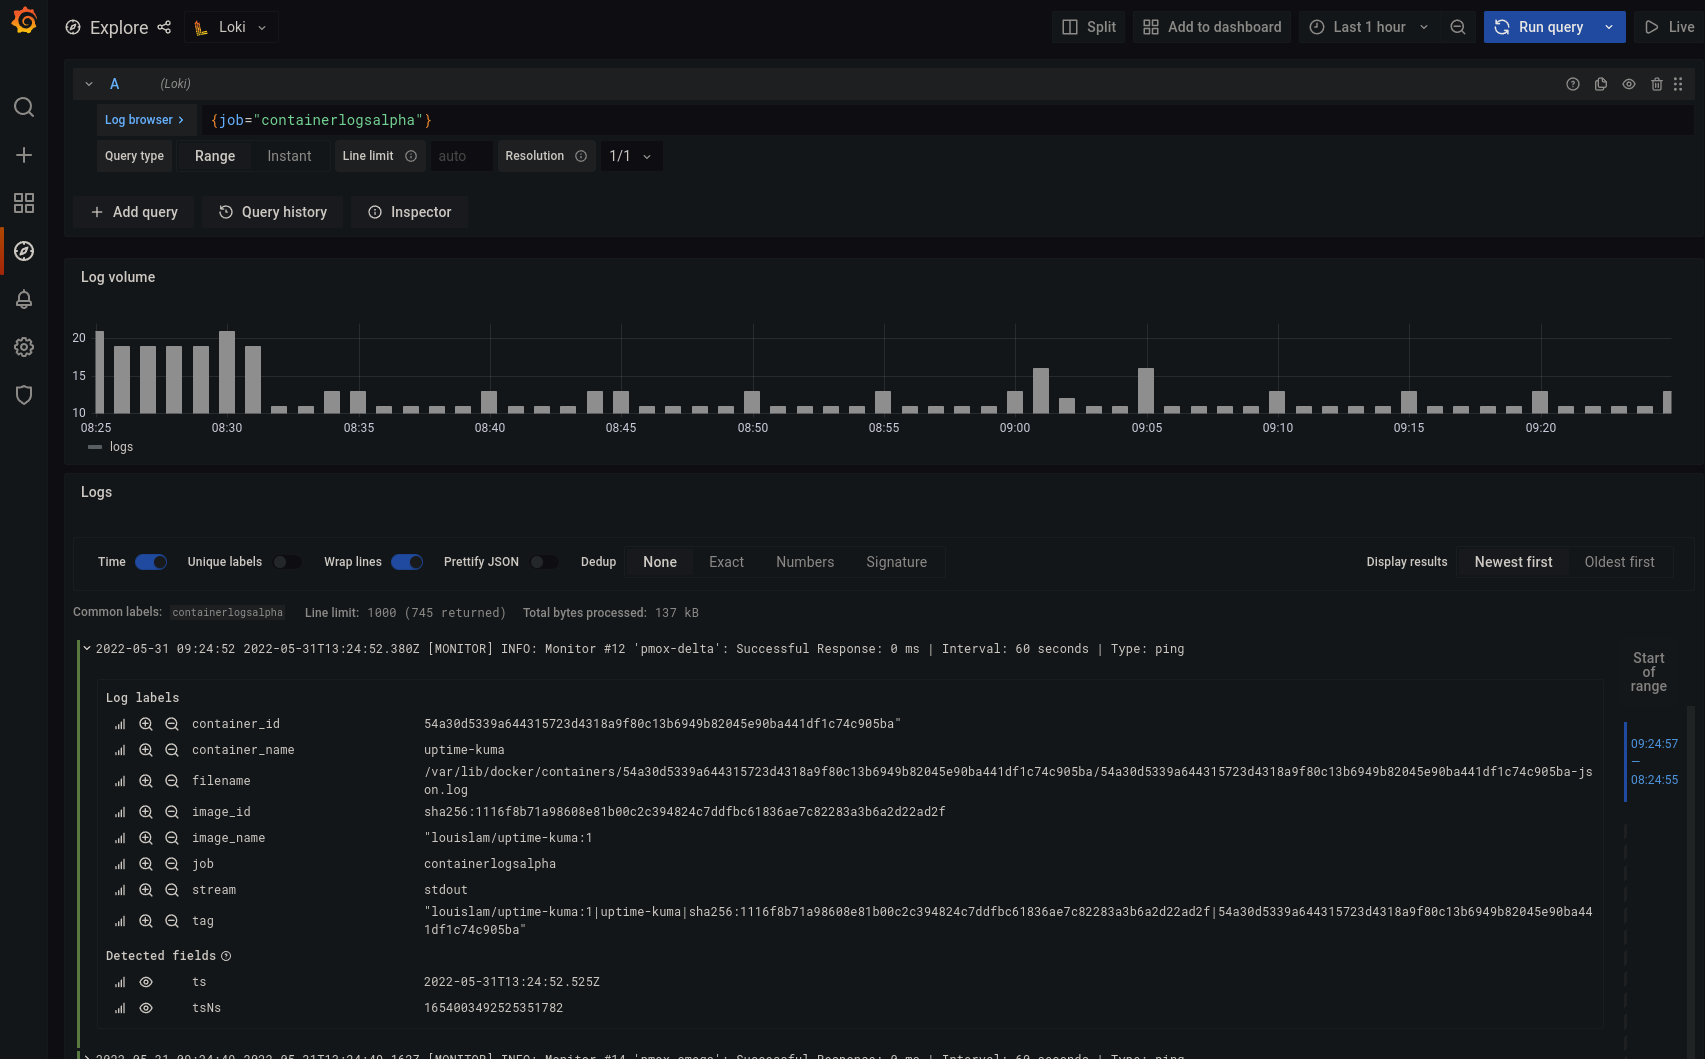
Now to view logs from the docker containers, enter {job="containerlogs"} in the search box. Note that the job name can be modified, I have labeled the jobs with a suffix to determine which host they came from.
Now, you can search for “error” in your logs with the following query:
{job="containerlogs"} |~ "(?i)error"The (?i) will ignore case of the string so it should pick up “error”, “Error”, “ERROR”, or whatever the app developers decided to use.
Now if you have set up prometheus as well, grafana should be all set up to look at your system metrics and logs all from one interface.
Next steps
You can save log queries as dashboard panels on grafana, so metrics and logs can be configured on the same dashboard.
Loki is able to import logs from more sources than I covered here. If you use rsyslogd on linux for example, loki can be configured to receive those logs.
I also recommend looking into configuring a firewall for your loki server so that only authorized systems can connect to the loki server. You can also set up a reverse proxy server to encrypt traffic to and from the loki server by serving loki over HTTPS. Check out a previous post to see how to set up a proxy server with docker.