A private AI stack on Kubernetes with the GPU Operator, Ollama, and Open WebUI
I have already run the first version of a private AI setup in my homelab: Ollama and Open WebUI on a Linux box, then image generation through Open WebUI and ComfyUI, and later local coding experiments with OpenCode and Ollama. Those setups proved the idea worked, but they did not fit into my homelab Kubernetes (k8s) ecosystem.
This post is a follow-up: moving the useful pieces into k8s so the private chatbot is managed like everything else in my Argo CD app-of-apps repo. The goals are still the same as before: prompts and uploads stay on my hardware, model weights run locally on a GPU I own, and the UI is available on my private network. The stack uses NVIDIA GPU Operator, Ollama, and Open WebUI, then plugs into two existing homelab services: my k8s SearXNG search instance and a CloudNativePG cluster for the chat database.
This is not an introduction to Ollama or Open WebUI. The earlier post covers the standalone version. Today I am deploying these on k8s: GPU scheduling, persistent model storage, Postgres-backed Open WebUI, SearXNG search, and GPU metrics. I am happy to be able to leverage some previous homelab projects since SearXNG has been one of the most useful self-hosted apps that I have set up.
The shape of the stack
The k8s version adds three apps (gpu-operator, ollama, open-webui) around two services I already had running (searxng, cloudnative-pg). They all live under argo-apps/apps/. The Helm-backed apps use the multi-source Argo CD pattern: an upstream chart, an in-repo values.yaml, and an optional templates/ directory for namespace, PVC, and other extras. SearXNG is the exception because the older Helm chart is archived, so that app is plain k8s manifests.
Prerequisites
Before deploying any of this, the cluster needs:
- Kubernetes with Argo CD installed and a working app-of-apps repo. Any reasonable distribution works; I use k3s.
- An ingress controller with a TLS Secret available in the namespace where Open WebUI will run. I use Cilium ingress with a wildcard certificate distributed by Reflector, but ingress-nginx or anything else is fine.
- A node with an NVIDIA GPU. The proprietary NVIDIA driver and
nvidia-container-toolkitmust be installed directly on the host before deploying the GPU Operator. On k3s the agent autodetects the toolkit at startup and registers thenvidiaruntime in containerd; other distributions may need a manual containerd config. - A storage class for general-purpose PVCs. Open WebUI keeps uploaded files and a small vector DB on a PVC; an NFS-backed StorageClass is a good fit because the pod can move between nodes.
- A storage class for local node-pinned volumes. Ollama’s models can be tens of gigabytes and should not redownload on every pod restart. I use a
local-storageStorageClass with a manually defined PV at a path on the GPU node. - A PostgreSQL cluster. I use CloudNativePG; my CloudNativePG post covers the install. Open WebUI accepts any PostgreSQL connection URL, so a hosted Postgres or any other server works.
- A SearXNG instance if you want web search. My SearXNG post covers the standalone and Kubernetes setup. (Optional: Open WebUI runs fine without it.)
Reserve the GPU node for AI workloads
A bare GPU node will accept any pod the scheduler throws at it. To make sure the GPU is reserved for the workloads that actually need it, taint the node:
kubectl taint node <gpu-node> workload=ai:NoScheduleWith this taint in place, only pods that explicitly tolerate workload=ai:NoSchedule can land on the GPU node. The GPU Operator’s component DaemonSets and Ollama will both declare the toleration.
When you create a taint that way it does not live in any manifest, so reapply it if the node is ever rebuilt.
GPU Operator: the lightest install
NVIDIA’s GPU Operator can manage the entire stack from drivers up to the device plugin, but with the driver and toolkit already on the host most of that is wasted churn. The chart supports a “lightest” mode that disables those subsystems and only ships the parts the cluster needs: the device plugin, Node Feature Discovery, validators, the DCGM exporter for Prometheus, and most importantly the RuntimeClass/nvidia resource.
# argo-apps/apps/gpu-operator/values.yaml
driver:
  enabled: false
toolkit:
  enabled: false
mig:
  strategy: none
daemonsets:
  tolerations:
    - key: nvidia.com/gpu
      operator: Exists
      effect: NoSchedule
    - key: workload
      operator: Equal
      value: ai
      effect: NoSchedule
node-feature-discovery:
  worker:
    tolerations:
      - key: node-role.kubernetes.io/control-plane
        operator: Equal
        value: ''
        effect: NoSchedule
      - key: nvidia.com/gpu
        operator: Exists
        effect: NoSchedule
      - key: workload
        operator: Equal
        value: ai
        effect: NoSchedule
The daemonsets.tolerations section matters: without workload=ai, the operator’s DaemonSets cannot land on the GPU node, which means no device plugin, which means the GPU is invisible to Kubernetes. The chart’s default tolerations include nvidia.com/gpu:NoSchedule already, but the user-defined taint has to be added. Node Feature Discovery has its own worker DaemonSet values, so it needs the same workload=ai toleration separately.
After Argo CD syncs, the node should report GPU capacity and the RuntimeClass should exist:
$ kubectl get node <gpu-node> -o jsonpath='{.status.capacity.nvidia\.com/gpu}'
1
$ kubectl get runtimeclass nvidia
NAME     HANDLER   AGE
nvidia   nvidia    ...
Ollama: bind it to the GPU
Ollama is the inference server. It loads a model into VRAM and exposes an HTTP API on :11434. The community otwld/ollama Helm chart wraps it nicely.
Two things need care: scheduling and storage.
# argo-apps/apps/ollama/values.yaml
runtimeClassName: nvidia
nodeSelector:
  workload: ai
tolerations:
  - key: workload
    operator: Equal
    value: ai
    effect: NoSchedule

ollama:
  gpu:
    enabled: true
    type: nvidia
    number: 1
  models:
    pull:
      - gemma4:31b
      - qwen3.5:9b

persistentVolume:
  enabled: true
  existingClaim: ollama-pvc
The pod needs all of runtimeClassName, the matching nodeSelector, the toleration, and a nvidia.com/gpu resource limit (the chart adds the limit when ollama.gpu.enabled: true). Drop any one of those and either the pod cannot schedule or it schedules without the GPU.
Choosing models
Ollama models are usually shipped at Q4 quantization and the rule of thumb is roughly 0.6 GB per billion parameters at that level, plus headroom for the KV cache and context window. Pick models that fit comfortably in your card’s VRAM:
- A 24 GB card (RTX 4090) handles a ~30B dense model at Q4 with a small context window, or a ~14B dense model with plenty of room for context.
- A 16 GB card handles ~13B dense models comfortably.
- Mixture-of-experts models like
qwen3:30b-a3bhave a larger effective parameter count but only a few billion active per token, so they fit in less VRAM than a dense model of the same size.
Ollama only loads one model into VRAM at a time and unloads it after five minutes of inactivity, so what fits at once is per-request, not the sum of everything pulled.
Persisting models on the node
Models can be tens of gigabytes and downloading them on every pod restart is wasteful. A local PersistentVolume pinned to the GPU node solves it:
# argo-apps/apps/ollama/templates/persistentvolume.yaml
apiVersion: v1
kind: PersistentVolume
metadata:
  name: ollama-pv
spec:
  capacity:
    storage: 100Gi
  accessModes:
    - ReadWriteOnce
  persistentVolumeReclaimPolicy: Retain
  storageClassName: local-storage
  claimRef:
    apiVersion: v1
    kind: PersistentVolumeClaim
    name: ollama-pvc
    namespace: apps
  local:
    path: /opt/ollama
  nodeAffinity:
    required:
      nodeSelectorTerms:
        - matchExpressions:
            - key: kubernetes.io/hostname
              operator: In
              values:
                - <gpu-node>
The PV’s nodeAffinity and the pod’s nodeSelector agree on the GPU node, so the pod and its data stay together. reclaimPolicy: Retain keeps the data on disk if the PVC is ever deleted. Pre-binding the PV to a specific PVC via claimRef avoids manual binding when the PVC is created later.
Open WebUI: front door, Postgres, and search
Open WebUI is the chat UI and orchestration layer. By default it stores chats, users, settings, and uploaded files locally with SQLite plus a flat directory. Both can be replaced.
Pointing it at Postgres
CloudNativePG generates a <cluster>-app Secret with a number of useful keys when a cluster bootstraps. The uri key is a fully formed postgresql://user:password@host:port/dbname string that Open WebUI accepts directly as DATABASE_URL. Putting Open WebUI in the same namespace as the Postgres cluster lets the env var reference the secret with a plain secretKeyRef:
extraEnvVars:
  - name: DATABASE_URL
    valueFrom:
      secretKeyRef:
        name: <cluster>-app
        key: uri
If Postgres lives in a different namespace, the fqdn-uri key on the same secret has the same value but with a fully qualified host, and either Reflector or External Secrets Operator can mirror the secret into Open WebUI’s namespace.
The full values
# argo-apps/apps/open-webui/values.yaml
ollama:
  enabled: false
ollamaUrls:
  - 'http://ollama.apps.svc.cluster.local:11434'

ingress:
  enabled: true
  host: ai.example.com
  tls: true
  existingSecret: tls-example

persistence:
  enabled: true
  existingClaim: open-webui-pvc

extraEnvVars:
  - name: DATABASE_URL
    valueFrom:
      secretKeyRef:
        name: memory-alpha-app
        key: uri
  - name: ENABLE_WEB_SEARCH
    value: 'true'
  - name: WEB_SEARCH_ENGINE
    value: searxng
  - name: SEARXNG_QUERY_URL
    value: 'http://searxng.apps.svc.cluster.local/search?q=<query>&format=json'
  - name: BYPASS_WEB_SEARCH_EMBEDDING_AND_RETRIEVAL
    value: 'true'
A few decisions worth flagging:
- Persistence stays on. Postgres holds the structured data, but the PVC still gets uploaded files, the local Chroma vector DB used for RAG, and any cached models like the embedding model that loads on first run. NFS is a fine backing class because the pod can move across nodes.
- No GPU for the UI pod. Open WebUI talks to Ollama over HTTP. It does not need its own GPU and should not consume GPU time. The chart’s default tolerations are empty, so the
workload=ai:NoScheduletaint on the GPU node naturally keeps the pod off. - The bundled Ollama is disabled.
ollama.enabled: falseplusollamaUrlspointing at the standalone Ollama service avoids running two copies of Ollama in the cluster. - Web search bypasses the extra vector retrieval hop. Open WebUI can either crawl search results into a transient Chroma collection and retrieve from that collection, or pass the loaded web documents straight through. In this cluster the direct path is more reliable for SearXNG search, so
BYPASS_WEB_SEARCH_EMBEDDING_AND_RETRIEVAL=trueis set.
Wiring SearXNG for web search
Open WebUI’s web search reads through whatever provider you point it at. SearXNG is local, privacy-respecting, and aggregates results from many engines. Two pieces need to line up.
Enable JSON output in SearXNG
Open WebUI calls SearXNG’s API expecting a JSON response. SearXNG ships with HTML output only by default, so add JSON to the formats list in settings.yml:
search:
  formats:
    - html
    - json
There are two places this has to be true. SearXNG must allow JSON in settings.yml, and Open WebUI must request JSON in SEARXNG_QUERY_URL:
- name: SEARXNG_QUERY_URL
  value: 'http://searxng.apps.svc.cluster.local/search?q=<query>&format=json'
Without format=json, the service call still returns 200 OK, but it returns HTML. That is enough to make direct curl tests look healthy while Open WebUI’s search integration quietly fails to produce usable sources.
Allowlist the cluster pod CIDR
SearXNG ships with a “limiter” that does much more than rate limiting. It also runs bot detection: it expects a cookie that real browsers acquire by visiting the search page, and it inspects request headers for browser-shaped user agents and Accept-Language. An API client like Open WebUI fails those checks on the very first request and gets 429 Too Many Requests immediately, regardless of frequency.
The clean fix is to allowlist the in-cluster pod CIDR via limiter.toml:
# /etc/searxng/limiter.toml
[botdetection.ip_lists]
pass_ip = [
  "10.42.0.0/16",
]
pass_ip exempts those source addresses from all bot detection. Public ingress traffic still goes through the full set of checks, but in-cluster pods are trusted. Mount it into the SearXNG container alongside settings.yml:
volumeMounts:
  - name: config
    mountPath: /etc/searxng/settings.yml
    subPath: settings.yml
  - name: config
    mountPath: /etc/searxng/limiter.toml
    subPath: limiter.toml
After a kubectl rollout restart deploy/searxng, Open WebUI’s queries show up in the SearXNG logs as WARNING:searx.limiter: PASS ... matched PASSLIST.
Keep SearXNG’s cache on the PVC
The official SearXNG container uses /var/cache/searxng for persistent cache data, so the k8s app mounts a PVC there. One subtle wrinkle is that SearXNG’s generic SQLite cache code uses Python’s temp directory for sxng_cache_DATA_CACHE.db and sxng_cache_ENGINES_CACHE.db when no explicit db_url is set. Setting TMPDIR=/var/cache/searxng keeps those cache DBs on the same PVC instead of the container’s ephemeral /tmp:
env:
  - name: FORCE_OWNERSHIP
    value: 'true'
  - name: TMPDIR
    value: /var/cache/searxng
volumeMounts:
  - name: cache
    mountPath: /var/cache/searxng
I briefly considered pre-creating the SQLite tables in an init container after seeing sqlite3.OperationalError: no such table: properties during startup, but that was too coupled to SearXNG internals. The less peculiar setup is to let the official container own the mounted cache directory and only point temp-backed cache files at that directory.
The Open WebUI trap I hit
The first version looked correct from the outside: SearXNG was reachable from the Open WebUI pod, /search?q=...&format=json returned results, Open WebUI created web-search-* Chroma collections, and the logs showed embeddings being generated. But chat responses still said no sources were found or that the model could not access search data.
Two things fixed it:
- name: SEARXNG_QUERY_URL
  value: 'http://searxng.apps.svc.cluster.local/search?q=<query>&format=json'
- name: BYPASS_WEB_SEARCH_EMBEDDING_AND_RETRIEVAL
  value: 'true'
The first line makes Open WebUI consume the JSON API rather than SearXNG’s HTML results page. The second line avoids the transient web-search vector retrieval path and passes loaded web documents through directly. Search still uses SearXNG and still fetches result pages, but it no longer depends on a second retrieval step to surface sources back to the model.
Upstream rate limits
A separate rate limit problem worth knowing about: upstream search engines (Google, Bing) rate-limit SearXNG’s outgoing requests, since a single residential IP making constant queries looks scrapery to them. SearXNG handles it gracefully, it suspends the offending engine for a few minutes and falls back to others, so the user-facing impact is reduced result quality, not failure. Disabling Google and leaning on DuckDuckGo, Brave, Mojeek, and the specialized engines (Wikipedia, arXiv, GitHub) is the usual workaround.
GPU metrics
The GPU Operator already deploys nvidia-dcgm-exporter on every GPU node. It just needs a ServiceMonitor with the release: prometheus label that kube-prometheus-stack discovers on. One more ServiceMonitor covers the operator’s controller metrics:
# argo-apps/apps/gpu-operator/templates/servicemonitor.yaml
apiVersion: monitoring.coreos.com/v1
kind: ServiceMonitor
metadata:
  name: nvidia-dcgm-exporter
  namespace: gpu-operator
  labels:
    app: nvidia-dcgm-exporter
    release: prometheus
spec:
  selector:
    matchLabels:
      app: nvidia-dcgm-exporter
  endpoints:
    - port: gpu-metrics
      interval: 30s
      relabelings:
        - action: replace
          sourceLabels: [__meta_kubernetes_pod_node_name]
          targetLabel: node
---
apiVersion: monitoring.coreos.com/v1
kind: ServiceMonitor
metadata:
  name: gpu-operator-controller
  namespace: gpu-operator
  labels:
    app: gpu-operator
    release: prometheus
spec:
  selector:
    matchLabels:
      app: gpu-operator
  endpoints:
    - port: gpu-operator-metrics
      interval: 60s
DCGM gives you the metrics you actually want from a GPU host: per-device utilization, framebuffer memory used and free, temperature, power draw, and SM/memory clock frequencies. The really useful trick is that DCGM cross-references the running pod and labels every metric with exported_container, exported_namespace, and exported_pod, so you can attribute GPU usage to the workload using it without an Ollama-specific exporter:
# VRAM used by Ollama, in bytes
DCGM_FI_DEV_FB_USED{exported_container="ollama"} * 1024 * 1024

# Did anyone hammer the GPU in the last hour?
max_over_time(DCGM_FI_DEV_GPU_UTIL{exported_container="ollama"}[1h])

# Power draw in watts attributed to ollama
DCGM_FI_DEV_POWER_USAGE{exported_container="ollama"}
For dashboards, NVIDIA publishes a Grafana dashboard for DCGM (ID 12239) that drops in cleanly and gives you the standard utilization / temperature / power / VRAM panels split by GPU.
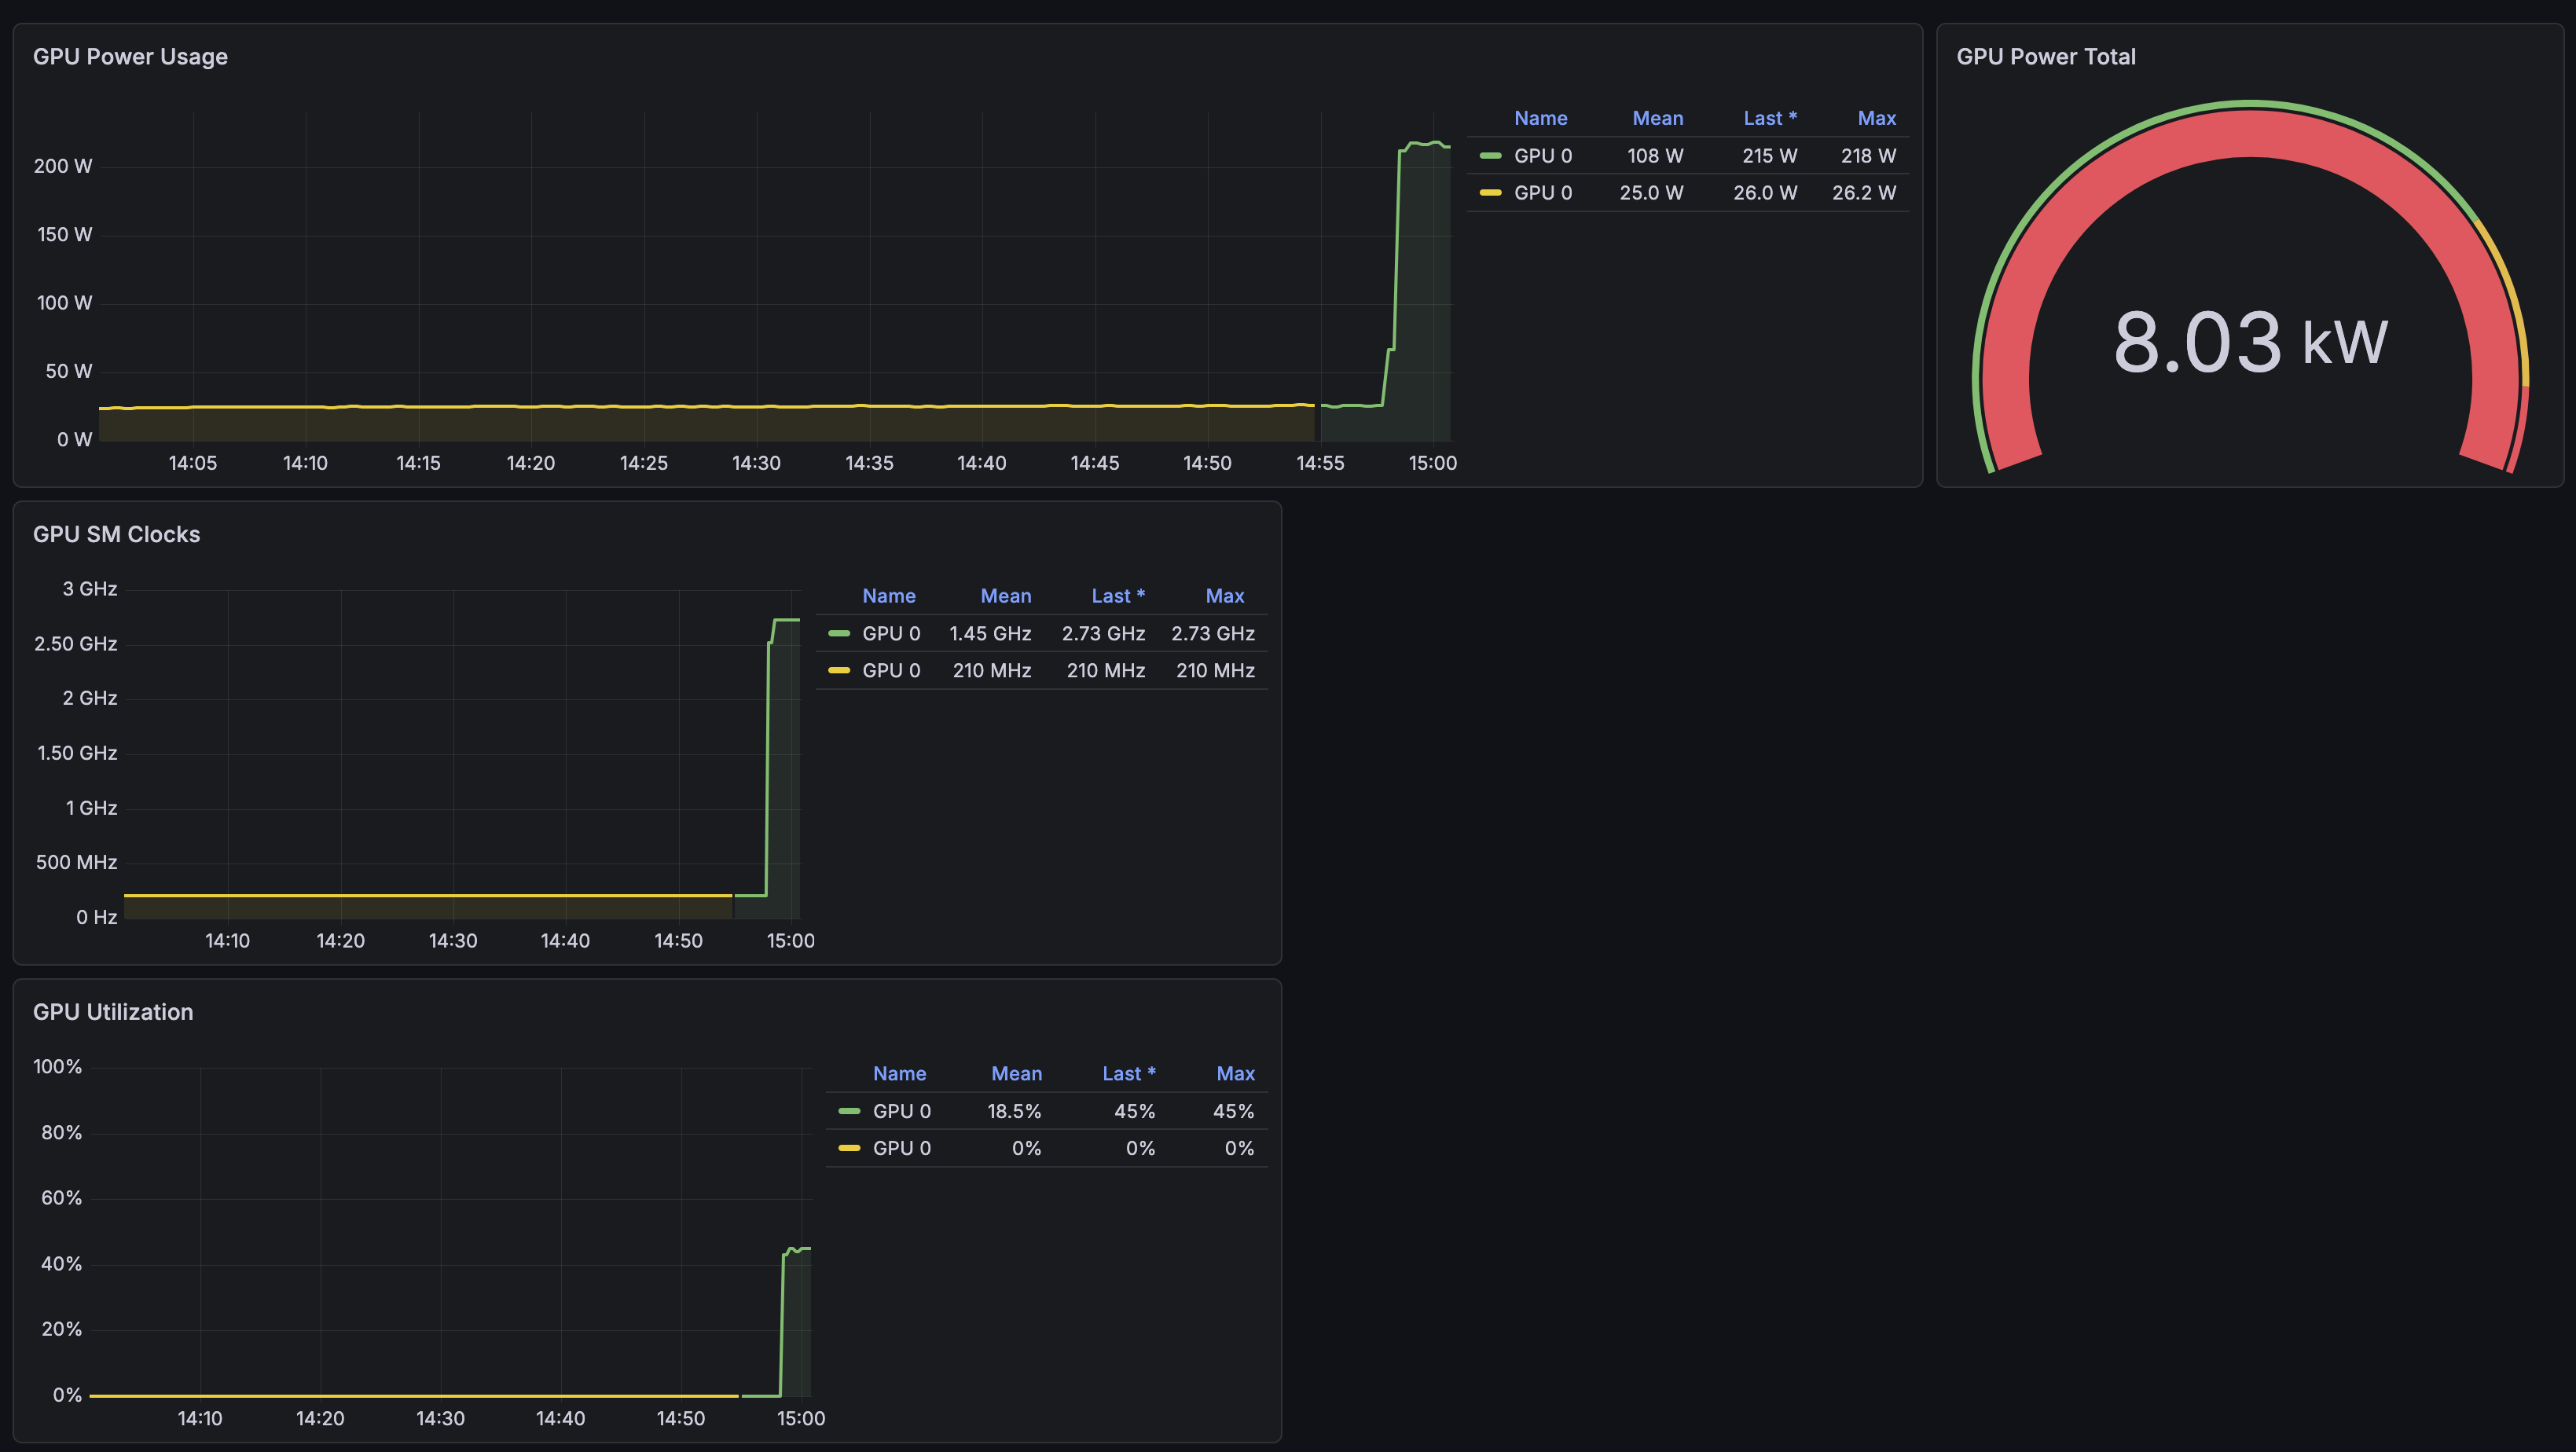
I might have to tweak this official dashboard, It looks a little off.
The rest of the stack does not expose Prometheus metrics natively. Ollama, Open WebUI, and SearXNG all lack a /metrics endpoint at the time of writing. Basic uptime is covered by kube-state-metrics (pod readiness, restart counts) and the GPU side is fully covered by DCGM, which is enough to know whether the stack is healthy and whether the GPU is doing work.
Validation
A round-trip smoke test:
# GPU is visible to Kubernetes
kubectl get node <gpu-node> -o jsonpath='{.status.capacity.nvidia\.com/gpu}'
# Ollama is up and saw the GPU
kubectl -n apps logs -l app.kubernetes.io/name=ollama | grep 'inference compute'
# inference compute id=GPU-... library=CUDA name=CUDA0
# description="NVIDIA GeForce RTX 4090" total="24.0 GiB" available="23.5 GiB"
# Ollama answers API requests
kubectl -n apps port-forward svc/ollama 11434:11434 &
curl -s localhost:11434/api/tags | jq
# Open WebUI can reach SearXNG and gets JSON
kubectl -n apps exec -i open-webui-0 -- \
python - <<'PY'
import json, urllib.request
url = 'http://searxng.apps.svc.cluster.local/search?q=openwebui%20searxng&format=json'
with urllib.request.urlopen(url, timeout=25) as r:
data = json.load(r)
print(r.status, r.headers.get('content-type'), len(data.get('results', [])))
print(data['results'][0]['title'])
PY
# Postgres has the open-webui schema after first chat
kubectl -n apps exec <cluster>-1 -- \
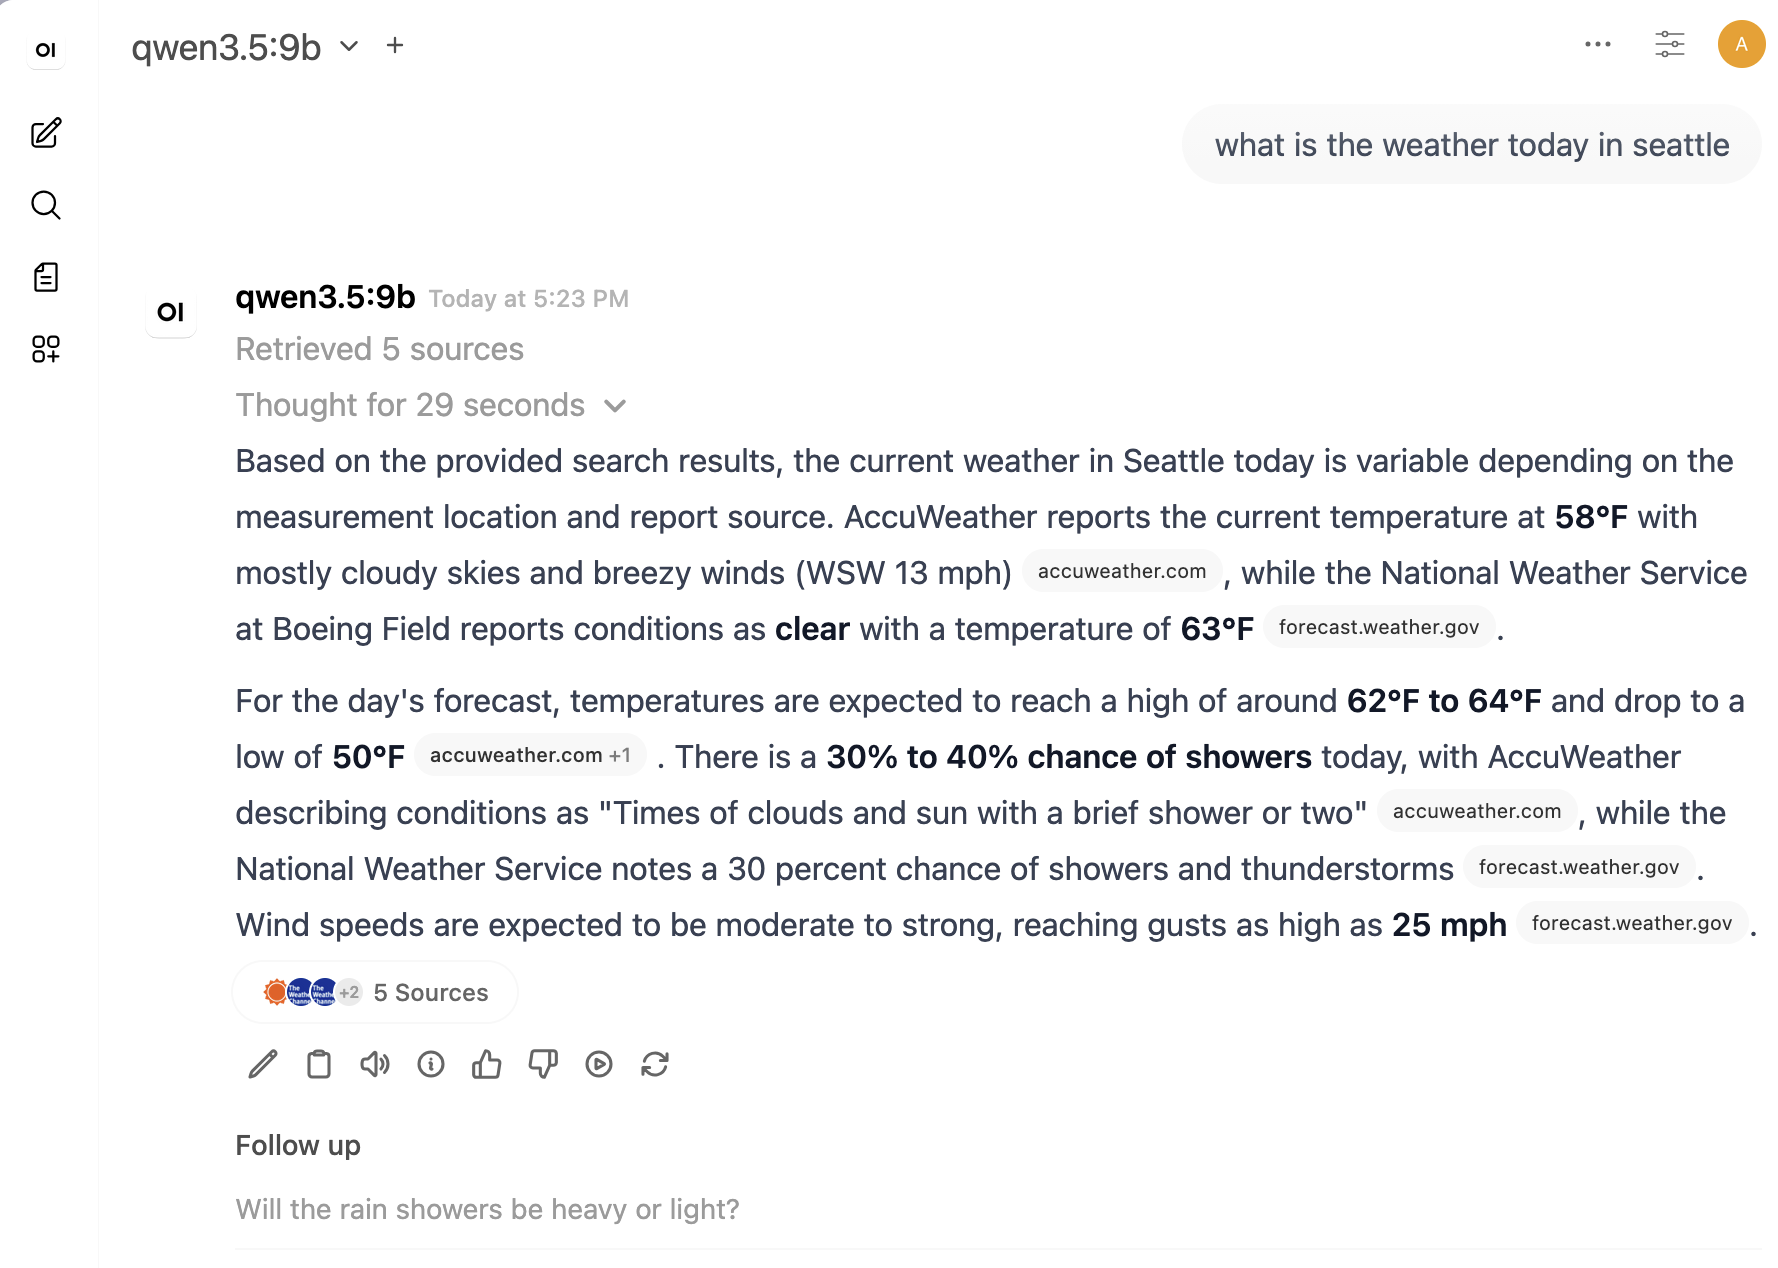
psql -U <user> -d <dbname> -c '\dt' | headIf those pass, you have a private chatbot. The final real-world check is in the UI: start a chat, enable web search, ask for something current, and confirm the response includes sources.
Related posts
- Running LLMs on your hardware
- Image generation in Open WebUI
- OpenCode and Ollama
- Running SearXNG as an alternative search engine
- CloudNativePG on Kubernetes
- [Kubernetes NVIDIA GPU setup][22]
Sources
- Argo CD
- NVIDIA GPU Operator
- Ollama
- Open WebUI
- SearXNG
- CloudNativePG
- k3s
- Cilium ingress
- Reflector
- ingress-nginx
- nvidia-container-toolkit
- Node Feature Discovery
- NVIDIA DCGM exporter
- otwld/ollama Helm chart
- kube-prometheus-stack
- NVIDIA DCGM Grafana dashboard
Disclaimer: I used an LLM to assist with this work and post. Opinions expressed are my own.